
2017 was a banner year for Exchange Traded Funds (ETFs).
According to data from Charles Schwab, Bloomberg, and Investment Company Institute, ETFs saw a record inflow of more than $800 billion in 2017. That inflow came at the expense of mutual funds, who saw an outflow of about $200 billion.

(Image Courtesy of Business Insider)
What’s even more impressive about ETFs earning a record $800+ billion inflow in 2017 is that the record before this was in 2016 …. At $286.5 billion.
Continue Reading →
During three separate interviews this week I was asked if I was seeing any signs of complacency among investors, markets, or clients.
If anything, the people I talk to are more concerned with the high probability of lower market returns in the future but my view is surely clouded by the clientele and readers I deal with on a regular basis.Whether my sample size is representative or not, measuring market sentiment is getting harder and harder these days. Everyone now has a megaphone to voice their opinions — social media, blogs, 24-hour financial television, podcasts, conferences, magazines, financial news websites, etc.I don’t see how you can reliably track sentiment when it comes at you every day like a wave that changes form and shape depending on people’s mood that day. There’s just not much signal in all of the noise anymore.Of course, investors have been given plenty of excuses to be complacent. It feels as though volatility and bear markets have been outlawed in 2017 and stocks in the U.S. haven’t seen a down year since 2008.Since I don’t see any reliable way to track the potential complacency of investors as a whole, I tend to look at different ways investors can be complacent depending on which type of market environment we’re in.For example, last month I read the Schroders Global Investors Study which surveyed over twenty thousand investors from around the globe to get their expected portfolio returns over the coming 5 years. The results show this group was a tad ambitious: Investors expect an annual return of 10.2% on their investments over the next five years, according to a major new study.The Schroders Global Investor Study (GIS) 2017, which surveyed 22,100 people from around the globe who invest, found millennials even more optimistic. Those born between 1982 and 1999 expected their money to make average returns of 11.7% a year between now and 2022.Older generations were more realistic. The Baby Boomer generation – born in the two decades after the Second World War – anticipated 8.6% a year.Millennials (born 1982-1999, aged 18-35): 11.7% Generation X (born 1965-1981, aged 36-52): 9.8% Baby Boomers (born 1945-1964, aged 53-72): 8.6% Silent Generation (born 1923-1944, aged 73+): 8.1%Double-digit annual returns over the next 5 years from current valuation and interest rate levels seems like a stretch to me. I could be wrong but investors with such lofty expectations after we just went through a period of above-average returns (at least in the U.S.) seems to be somewhat complacent to me.Here’s another example (although this is more delusional than complacent):
Benchmark indices were flat on Friday even as minutes of the central bank’s policy panel meeting stoked expectations of an interest rate hike, with losses in financials and metals overshadowing gains in information technology stocks.
The S&P BSE Sensex ended at 34,416, down 12 points while the broader Nifty50 index settled at 10,564, down 1 points.
The rupee dropped to its lowest in more than a year following a hawkish tone in the minutes, released on Thursday, of the Reserve Bank of India’s monetary policy committee (MPC) meeting that took place earlier this month.
Among sectoral indices, the Nifty PSU Bank index slipped nearly 2.5% led by a fall in shares of Bank of India and IDBI Bank.
Investors cheered the results of Tata Consultancy Services, sending its shares to an all-time high of Rs 3,421 after the country’s top software services exporter posted its biggest-ever profit on Thursday.
Prakash Constrowell share price rallied 10% after the company has been declared L-1 bidder by the MCGM (Municipal Corporation of Greater Mumbai) for the new project Dumpsite Reclamation at Mulund Dumping Ground (MDG) in Mumbai by adopting suitable technology for existing garbage dump.
J B Chemicals & Pharmaceuticals fell 2.33% to Rs 312.65 on BSE after the company said it received an order from Pollution Control Committee, Daman for closure of its formulation manufacturing facility at Daman.
They were once seen as among India’s most promising growth stories. Now, however, the fate of ABG Shipyard, Alok Industries and Lanco Infratech is seen as near-certain but in the opposite direction. With huge debt, few takers for their assets and the whopping write-offs (‘haircuts’) that banks are likely to take on the loans given to these companies, industry experts believe liquidation of the trio are among the few options. All three have defaulted on their huge payment obligations.
Continue Reading →
When you first start trading, the most likely short term outcome bar far is that you will blow up account.And then quit. But it doesn’t have to be this way! If you avoid these simple beginner trading mistakes then I guarantee that you will have a better shot at trading long enough to become consistently profitable.
Ninety percent of traders lose ninety percent of their money in ninety days. Or so we are told. No one really knows if that is true. Avoid these 7 beginner trading mistakes and hopefully you will avoid become a trading casualty statistic!
-
Trading too large
Blowing up your account need not be inevitable. But if you insist on risking five, ten, twenty…even one hundred percent of your account on your first trade, I can almost guarantee you that you will eliminate your trading account long before the ninety days are up.
Continue Reading →
The Fibonacci sequence is being used by traders to get some indication of how the market is likely to move.
Advanced trading education sometimes involves figuring out quite strange and seemingly illogical concepts. But these could make the difference in your performance in stock trading.
Can the Fibonacci numbers help predict market moves? According to experienced analyst Martin Tillier, they apparently can, though he was skeptical when initially introduced to the concept. When you think about it, it doesn’t quite seem logical to believe that calculating major stock market levels on the basis of some mathematical sequence actually works. Can the figures thrown up by a numerical relationship affect the real world stock prices?
The Fibonacci Sequence
LiveScience defines the Fibonacci sequence as number series where you get to a number by adding the two numbers just before it. So if you start with 0 and 1, and the sequence is 0, 1, 1, 2, 3, 5, 8, 13, 21, 34, etc. The concept has its origin in the theories of many scholars of ancient Indian mathematics, particularly Pingala in 200 BC, Virahanka in 700 AD and Hemachandra in 1150. It was introduced to the Western world by Italian mathematician Fibonacci in his book Liber Abaci in 1202.
Continue Reading →
Benchmark indices rose for a seventh straight session on Friday, their longest winning streak since November 2017, on the back of gains in index heavyweights such as Reliance Industries and ICICI Bank.
Sentiment was also upbeat after retail inflation eased to a five-month low in March, but remained above the central bank’s medium-term target, supporting views that monetary policy is likely to remain unchanged at the next review in early June.
Investors now await January-March corporate results for future direction. IT Major Infosys will kick-start the March-quarter results season later in the day.
The S&P BSE Sensex ended at 34,193, up 92 points while the broader Nifty50 index settled at 10,481, up 22 points.
KPIT Technologies rose for a third straight session, quoting at Rs 230.5, up 1.86% on the day as on the NSE. KPIT Technologies is up 79.24% in last one year as compared to a 14.96% gain in Nifty and a 33.16% gain in the Nifty IT index.
Continue Reading →
Over 90% over traders will end up losing money in the stock market. Chances are if you are reading this you are probably loser in the Market. In order to encourage you to quit before you lose all your money, I created a list below to make you realize you are terrible at trading and should probably find another dream to pursue.
- You follow “professional” traders on twitter. The truth is many on twitter are complete phonies and have built a fake trading persona to end up selling you something in the end. More on this can be found on my guide on how to identify fraud traders.
- You look at inspirational quotes or quotes given by “famous” traders as part of your trading regimen. This is non-sense, this won’t help you.
- You assume psychology is a major part of trading, much more than an actual system. As such, you constantly remind yourself that you lost money in your last trade because of psychological mistakes and thus you refer to #2 on the list to regain focus (stupid trading quotes). If psychology was such a big part the simple solution would be to write programs that would trade for you (this isn’t a money maker). The truth is, many “professional” traders instill that psychology is big so that they can sell you their products for improving your “weak” psychology. Just to be clear I am sure most of you lack discipline, but even with discipline you still would lose money.
Continue Reading →
It’s easy to understand how there might be a pattern in the market that shows we have an edge or a reason to put on a trade. Maybe some combination of factors or patterns shows us that a market is more likely to go up over a certain time period, so we buy it. That’s pretty easy to understand, and it’s how most people think about trading.
There is another way to think about patterns, and I think this is more powerful. We can take a pattern, and then think several steps ahead. Through much the same process a beginning chess player might go through, in which he thinks “ok I move here and then maybe he moves here… and when he moves there I’ll do this… but wait… if he does this instead, then I would do this…” We can play a similar game with the market, looking at how prices and patterns are developing, and thinking a few steps ahead. Take a look at the chart below, which shows the S&P 500 futures a few days after a sharp selloff. I’ve also highlighted two possible scenarios, in light orange and blue, that might have played out. Here’s the chart:

Continue Reading →
Benchmark indices ended flat on Friday, as investors remained cautious after sentiment soured on renewed fears of a trade war after US President Donald Trump proposed more tariffs on China.
Back home, the Reserve Bank of India (RBI) on Thursday adopted a remarkably dovish tone, surprising analysts who were expecting the firming up of rates in the medium term, even as one of the six members in the Monetary Policy Committee (MPC) voted for a hike in an otherwise status quo policy.
The S&P BSE Sensex ended at 33,627, up 30 points while the broader Nifty50 index settled at 10,331, up 6 points.
Reliance Communications Ltd (RCom) said on Friday it received the National Company Law Appellate Tribunal’s (NCLAT) approval to proceed with the sale of its tower and fibre business.
Shares of public sector bank were in focus for the second straight day with Nifty PSU Bank index nearly 1%, extending its Thursday’s 5% surge, after the Reserve Bank of India (RBI) maintained status quo on the key short-term borrowing rate in its first bi-monthly monetary policy for the financial year 2018-19 (FY19) on Thursday.
Punjab National Bank (PNB), Allahabad Bank, Oriental Bank of Commerce, Bank of Baroda, Union Bank of India, Bank of India and Canara Bank were up in the range of 1% to 4% on the National Stock Exchange (NSE).
Continue Reading →
Momentum stocks can grow your trading account exponentially if you know how to manage risk, find good entries, and stick to your trading plan. New and inexperienced traders have to be especially careful because they can destroy there account as quickly as it can grow. Here are some of the best strategies and tips you can use to maximize your profits on these stocks.
Daily Chart Breakouts
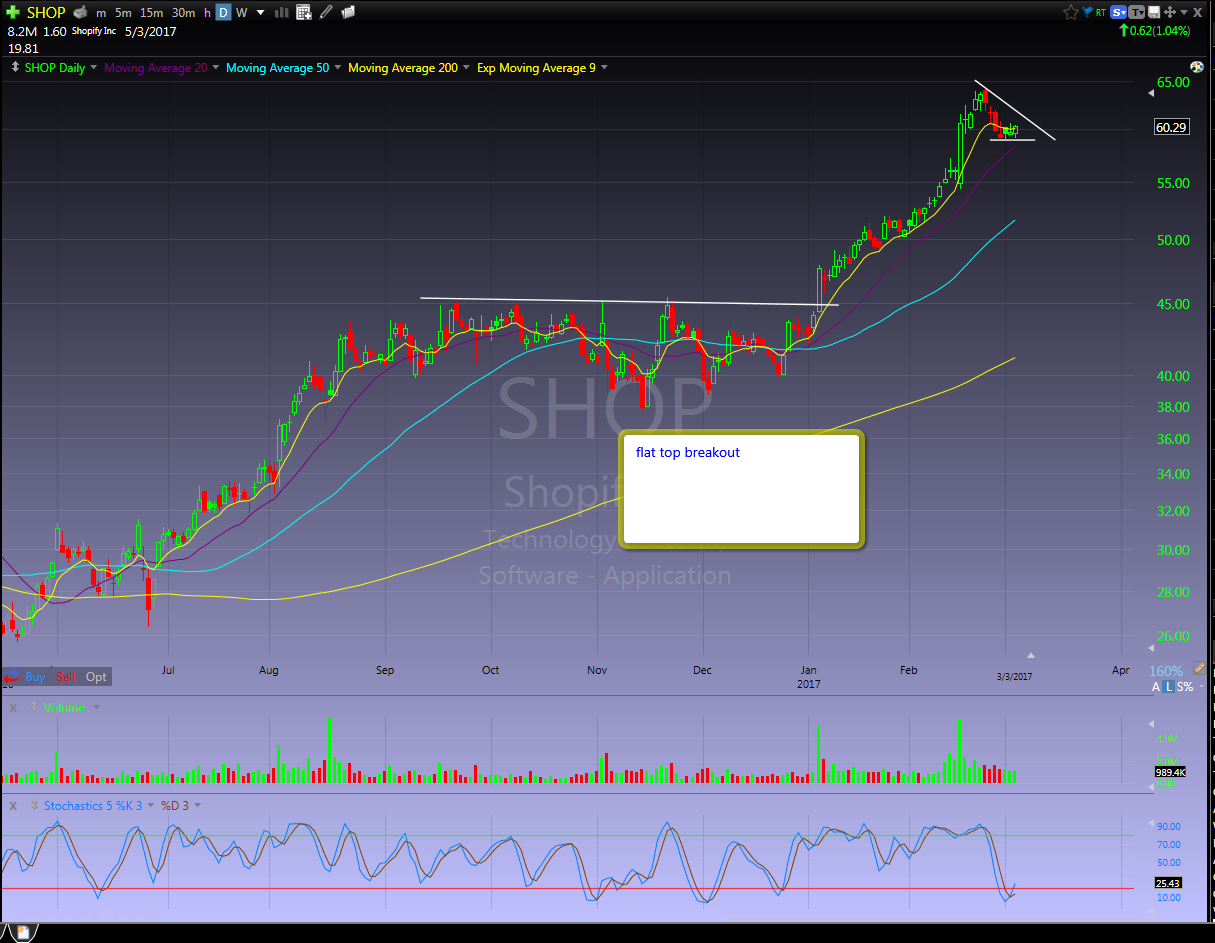
Daily chart breakouts are a great daily context to play for momentum plays. The bias is obvious, it is easy to define your risk, and there is usually great risk versus reward. For newer traders, it is easier for most to play setups that are joining an existing trend. You want to look for long periods of consolidation before playing a breakout, like we see with SHOP above. The longer a stock is trading within a range, the more powerful the move will be when it breaks major resistance or support.
Continue Reading →


