Reblog: The Importance of Liquidity and Leverage


If you want to trade macro, you need to understand liquidity.

PTJDruckSorosDalio — all these legends have expressed this fact multiple times.

Liquidity is what moves markets.

This is even more true now than in the macro heydays of the 70s and 80s.

With the rise of “blind investing” in the form of passively buying and holding ETFs, the majority of investors don’t care about valuation or merit. They just auto-shuttle their excess funds to the nearest robo advisor without a second thought.

This amount of “excess funds” is largely dependent on liquidity conditions.

When liquidity is loose, it’s cheap to get levered. People have extra cash and plow it into risk assets. Prices rise.

When liquidity is tight, people have less cash to spend. They may even sell stuff to service their existing debt. Prices fall.

There are a myriad of ways to measure and monitor liquidity conditions.

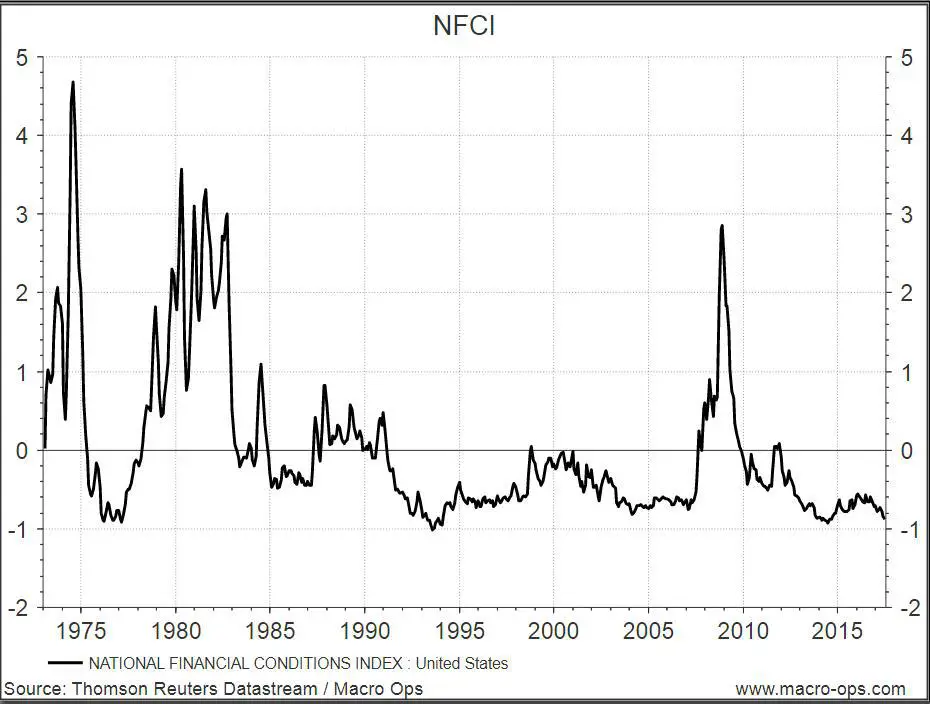
No single method is best, but one of our favourites is using the Chicago Fed’s National Financial Conditions Index (NFCI).

This index combines over 105 different indicators of financial activity to form one easy-to-read liquidity measurement. Money markets, debt markets, equity markets, traditional banking systems, “shadow” banking systems — they’re all included.

The zero line represents average liquidity conditions. Positive values indicate tighter-than-average conditions and negative values indicate looser-than-average conditions.

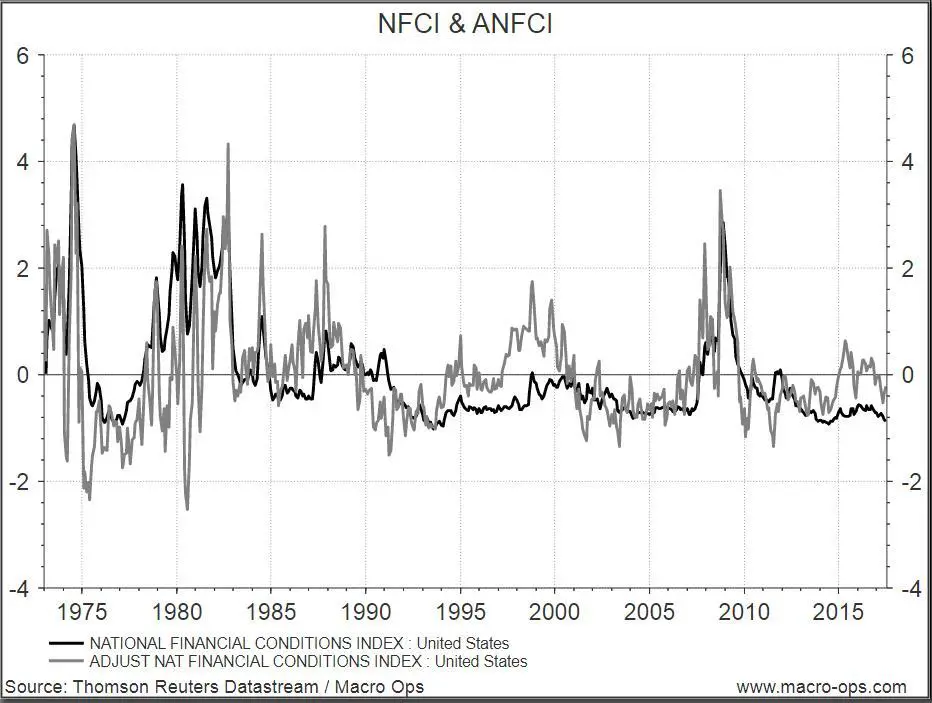
The Chicago Fed also publishes the Adjusted National Financial Conditions Index (ANFCI).

Since financial liquidity conditions are highly correlated to economic conditions, this index isolates the uncorrelated component. It tells us what liquidity conditions are like relative to economic conditions.

Positive values indicate liquidity conditions are tighter than would be suggested by current economic conditions, while negative values indicate the opposite.

You can see the difference between the standard and adjusted index in the graph below.

We prefer the ANFCI because it isolates liquidity conditions better than the NFCI.

The NFCI doesn’t always tell you when liquidity is deteriorating. In the late 90’s and 2014/2015, liquidity conditions were worsening but the strong stock market and strong economy kept the NFCI below 0, signalling liquidity was loose.

In contrast, the ANFCI was above 0 during the same period, signalling conditions were actually tightening.

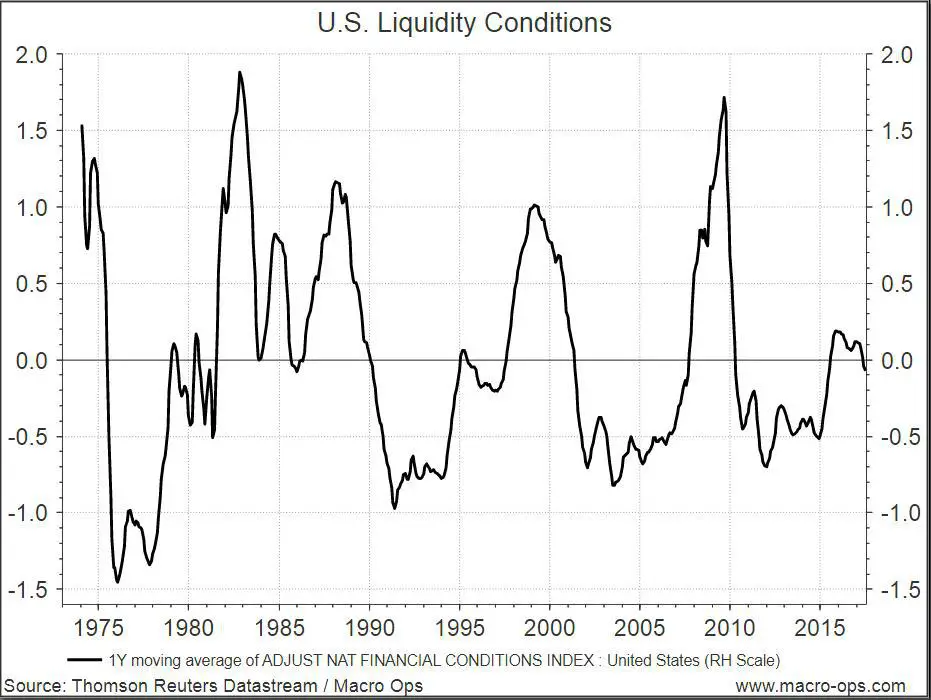
The ANFCI is a little noisy to look at, but if you smooth the data with a 12-month MA, you get a nice picture of liquidity conditions in the U.S.

The cyclical nature of our economy becomes clear and it’s easy to see how liquidity predicts business cycles. You can use this tool to help you trade on the right side of the market.

When liquidity is tightening, take bearish trades. When liquidity is loosening, take bullish trades.

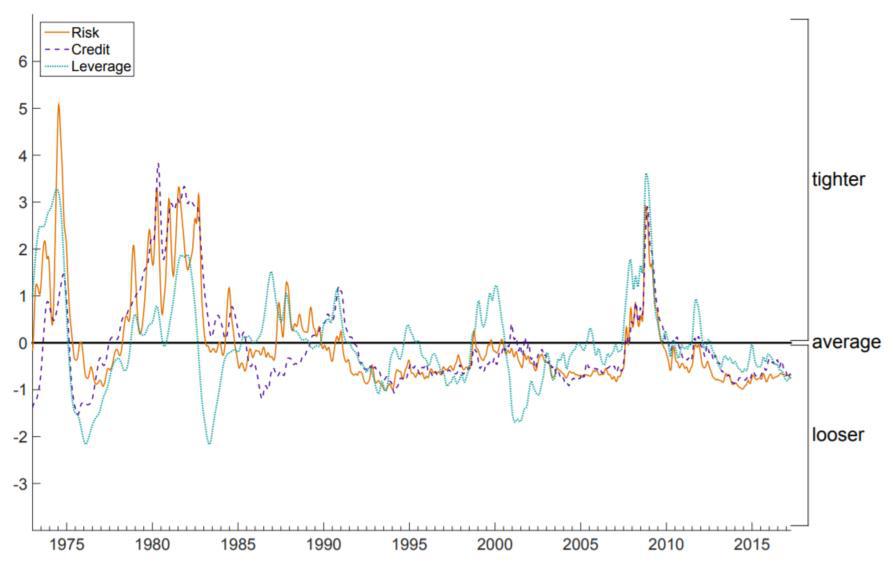
This index is also broken down further into 3 sub indices — risk, credit, and leverage.

Risk is a coincident indicator, credit is a lagging indicator, and leverage is a leading indicator of financial stress.

For trading purposes, the leverage part of the equation matters the most to see where the stock market is headed.

Above average leverage sows the seeds for a recession and a falling stock market. Below average leverage precedes economic booms and stock market rallies.

Ray Dalio discovered this logic long before the Chicago Fed and has made billions trading off it.

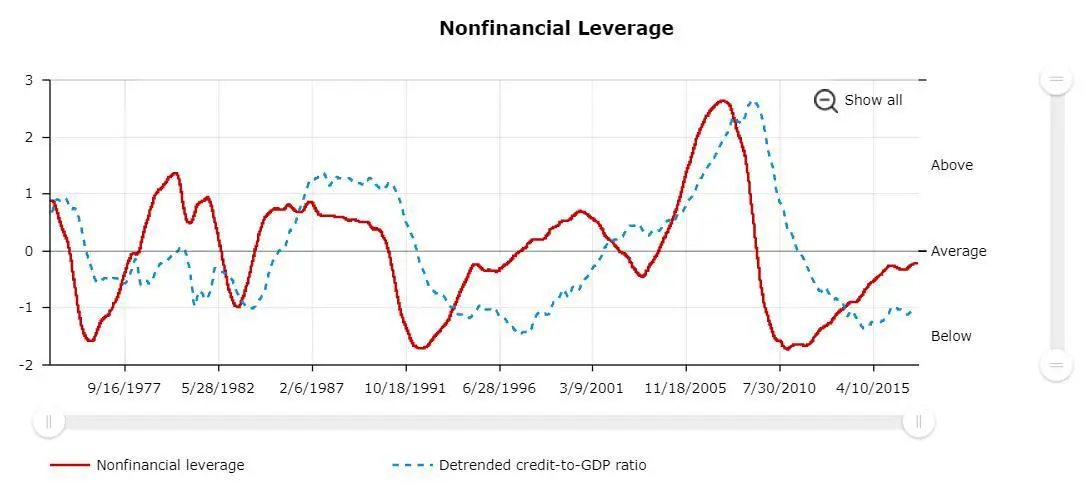
The leverage index can be broken down yet again to only include non financial leverage.

Non financial leverage is one of the most powerful leading indicators of stock market performance.

Liquidity, The NFCI, And Leverage

This graph might look familiar to you because it’s basically the short-term debt cycle, which can help you time markets.

For example, debt was at obscene levels before 2008 and signalled a shorting opportunity. And by 2010 debt was back below average and signalled a buying opportunity.

People are always the most levered at a market top and the least levered at a bottom.

A skilled macro trader wants to do the opposite. Paying attention to non financial leverage will help you do that.

Lever up when others are unlevered and de-lever when others are highly levered.

Despite all the financial doom and gloom we’re drowned with nowadays, non financial leverage readings tell a different story.

Current levels are only average.

Before making your next trade, take a look at these indicators.

How’s liquidity? Where are we at in the debt cycle?

Knowing these answers will make you a lot more confident in your trading. It’s hard to get blind sided by a big crash or miss out on a huge rally when you have a handle on liquidity.

Summary

  • Liquidity is a key variable in determining the macro landscape
  • We can monitor liquidity using the ANFCI
    • If the ANFCI is trending higher, liquidity is tightening and we want to lean bearish
    • If the ANFCI is trending lower, liquidity is loosening and we want to lean bullish
  • The non financial leverage component of the NFCI tells us where we are in the debt cycle
  • We want to buy risk assets at the bottom of the debt cycle (below average leverage) and sell risk assets at the top of the debt cycle (above average leverage)

This is a guest post by Alex @MacroOps which was posted originally here: Liquidity, The NFCI, And Leverage 

This post appeared on newtraderu.com and is available here.


Reblog: The Rare Trading Edge


Being a profitable trader is not just about changing what you do but who you are. Unprofitable traders tend to be impulsive, greedy, impatient, and take actions that are random. You don’t need to do one great trade, the odds are that one big trade will cause more damage than good. Like most lottery winners that end up bankrupt most new traders with windfalls from luck give all the money back when the risk of trading too big catches up with them in big losses. The skills a new trader needs to learn is creating good trading signals, proper position sizing, the discipline to follow their plan and the flexibility to go with the price action.

The magic happens after consistently following a quantified trading system day after day and month after month and let profits play out. The sustainable money in trading is learning how to minimise losses, exit winning trades while the money is still there and the compounding of capital over time. The magic happens with the creation of a system that fits your own beliefs and risk tolerance and the repeating of your entries and exits over time.

There are many profitable systems that can make you money, if it was a matter of an idea or a backtest everyone would be rich. It is the execution of the right idea over time with discipline and self control that makes all the difference. The rare trading edge is the trader’s mastery of their own mind and emotions.


Reblog: Linda Raschke’s 12 Technical Trading Rules


Linda Raschke

Market Wizard Linda Raschke’s Technical Trading Rules

  1. Buy the first pullback after a new high. Sell the first rally after a new low.
  2. Afternoon strength or weakness should have follow through the next day.
  3. The best trading reversals occur in the morning, not the afternoon.
  4. The larger the market gaps, the greater the odds of continuation and a trend.
  5. The way the market trades around the previous day’s high or low is a good indicator of the market’s technical strength or weakness.
    Continue Reading

Reblog: 7 Expensive Things for Traders


  1. Trading with no stop losses. You can’t control how big your profits are, the market will trend as far as it does. However, you can control and limit the size of your losses with a stop loss and a carefully managed positions size. Not having an exit plan if you are wrong can be very expensive when a trend takes off against your position and you start hoping instead of just cutting your losses and moving on.
  2. Your opinion can cost you money. Trading your opinion against all other market participants can be very expensive. The market goes where it wants and when you disagree with where it is going it will cost you. Going with the flow in your time frame is the best way to make money. Fighting the flow of the market can be expensive.
  3. Egos are expensive things. Inflated egos cause a trader’s #1 priority to be proving they are right and refusing to admit when they are wrong. It is very expensive for ego gratification to be higher on a trader’s list than making money.
  4. Trading off predictions can cost a lot of money when they are wrong. There is more to be made by reacting to what the market is doing instead of predicting what you think it will do later. The future does not exist and it is expensive to pretend like it does.
  5. Stubbornness causes small losses to become big losses. It causes a trader to make the same mistake over and over because they do not assimilate feedback. Instead they keep doing the same thing over and over and expect different results but keep getting the same results. Stubbornness is expensive.
  6. Not having an exit strategy for a winning trade can be very expensive. It is possible to ride a big winning trade back to even. If there is no plan to lock in profits while they are there a winning trade can even turn into a big loser. Trailing stops and targets can put the profits in the bank.
  7. Trading too big of position sizes for your account can be very costly because no manner how good your winning trades are you are set up to give back the profits with a few big losing trades in a row.

The original article posted by Steve Burns appears on newtraderu.com and is available here.


Reblog: The Best Price Action Candlestick Patterns


Bullish engulfing, as well as, bearish engulfing are two of the most powerful price action candlestick patterns. I have mentioned them briefly in my Candlesticks article, but now I want to put more emphasis on those two. More than that- bullish engulfing and bearish engulfing patterns are deeply ingrained in my trading strategy. Let’s explore what those two candlestick price action patterns can help us achieve.

INTRODUCTION– Bullish Engulfing and Bearish Engulfing- Probably The Best Price Action Candlestick Patterns

This article will be divided into two parts- first part will deal with the bullish engulfing pattern; the second part will go over the bearish engulfing candlestick pattern. History repeats itself, so I believe that the best way to read the market is to know what happened in the past. Bullish engulfing patterns are a confirmation that more buyers want to join the uptrend. On the other side, a bearish engulfing pattern gives confirmation for more sellers joining the short side. Let’s move to the first part- the bullish engulfing candlestick pattern.

PART 1– Bullish Engulfing Candlestick and Price Action

What is a candlestick?

Before I move to the real part, I would like to remind you once again what is a candlestick.
A candlestick contains an instrument’s value at open, high, low and close of a specific time interval.

Let’s say we are looking at a daily candlestick. It does contain the value at open, high, low and close on any particular day.

Continue Reading


Reblog: Where Do Our Greatest Trading Mistakes Come From?


Where do our greatest trading mistakes come from while we are trading the financial markets? They arise primarily from within. It is not the price action that causes our missteps and mistakes but our response to the price action.

  1. Your ego will cause you to allow a small loss to grow into a big loss because you do not want to be made wrong by exiting with a loss. Ego wants to hold on until you can at least get back to even. Not locking in a loss but holding it until it gets back to even gives the ego some gratification. This is also what creates many resistance levels at old support when people are given a second chance to get out at even.
  2. Trading what you think is going to happen instead of what is happening can keep people on the wrong side of trends for days, weeks, and months. Imposing your own opinions on price action instead of following it can cause big losses or to miss big trends while think the market is wrong and we are right.
    Continue Reading

Reblog: 6 Technical Indicator Signals Basics


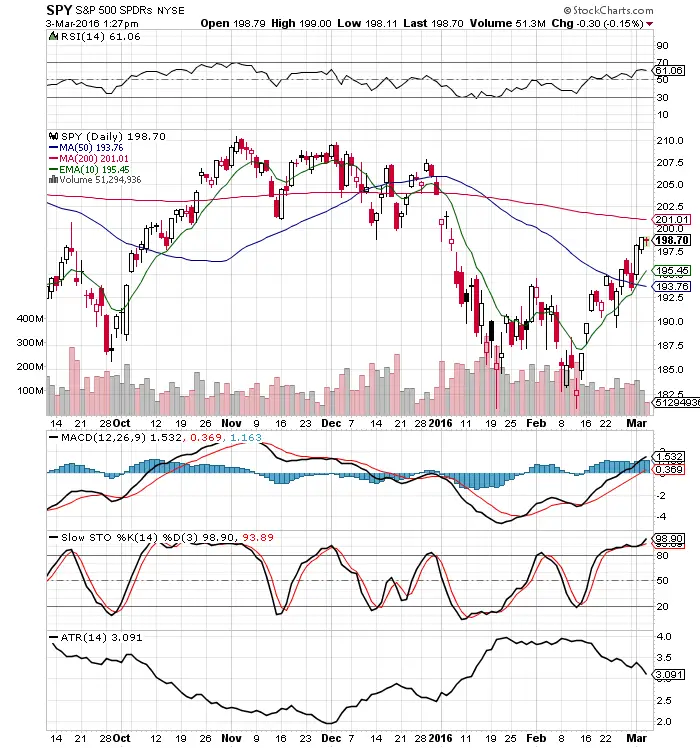
Chart Courtesy of StockCharts.comChart Courtesy of StockCharts.com

Signals help traders filter out their opinions and focus on price action. These tools help capture trends in your own time frame.

  1. The 200 day SMA measures the long term trend. Price above long term bullish, prices below signal long term bearish.
  2. The 10 day EMA measures the short term trend. Price above short term bullish, prices below signal short term bearish.
  3. The MACD crossover can signal an intermediate swing trade.
  4. The Slow Stochastics crossovers can signal short term reversals in the trend.
  5. A declining ATR shows volatility decreasing and an ascending ATR shows volatility increasing. This is a signal to help calibrate position sizing.
  6. The RSI shows the risk/reward ratio increasing and decreasing. The 30 RSI favours the bulls risk/reward for entry and the 70 RSI favours the short sellers risk / reward ratio.

The magic of these trading indicators comes when you combine them to create your own trading methodology that fits your own risk tolerance levels and then trade your system with the right risk management and discipline.

The original article is posted by Steve Burns on newtraderu.com and is available here.


Reblog: 10 Things A Trader Needs to Give Up


It is easy to become obsessed with adding to our trading arsenal with knowledge, books, chart patterns, indicators, moving averages, and gurus, that we forget to analyse what we need to remove from our plan.

One of the largest determining factors as to whether a new trader ends up as a winning trader, is how well they can filter out what doesn’t help them make money. Traders can’t follow every indicator, trade every method, and endlessly add to their trading methodology. As traders we have to make choices. We must know what makes money and what to remove from our trading strategy.

  • Give up your need to be right: The market is always right, don’t strive to be right in your predictions and opinions. Strive to go with the flow of the market.
  • Give up control: No matter how long you watch a live stock stream, you have no power over the movements. Save your emotional energy by not trying to cheer on your positions and get wrapped up in every price tick.

Continue Reading


Reblog: A Guide To Stop Losses


“Whenever I enter a position I have a predetermined stop. That’s the only way I can sleep at night. I know where I’m getting out before I get in.”- Bruce Kovner

The biggest reasons traders end up unprofitable is simply because their big losses knock out all their previous gains.

If you went back and removed your biggest losses over the past few months or year what would your trading results look like? Many of the best traders I know did this at some point in their trading careers and had an enlightening moment. The major factors that made them unprofitable or caused them big draw downs in capital were the big losses. The roots of the big losses were usually based in emotions and ego not a market event. A big loss is almost always caused by being on the wrong of a trend and then staying there.

What are the top 10 root causes of big losses in trading?

  1. Too stubborn to exit when proven wrong: You just refuse to take a loss; you think a loss is not real as long as you do not exit the trade and lock in the paper losses.
  2. Too much ego to take a loss: You are on the wrong side of the market trend but think if you hold a losing position you can be proven right on a reversal. While you are waiting to be proven right your loss gets bigger and bigger.
    Continue Reading

Reblog: Ray Dalio Trading System Explained


This is a Guest Post by AK of Fallible

AK has been an analyst at long/short equity investment firms, global macro funds, and corporate economics departments. He co-founded Macro Ops and is the host of Fallible.

In this video we’re going to discuss how Ray Dalio created his investment strategy and how you can use the same principles to create your own!

Continue Reading