Reblog: MACD Trend Following Strategy- Simple to learn Trading Strategy


MACD Trend Following Strategy

If you’re searching for that one trend following strategy that will turn your trading around, then today’s your lucky day. The MACD Trend Following Strategy as the name suggests is one of the best trend following strategies and this strategy is similar to our trend following strategy we have developed a while back. One of the most important features of trend following strategies is that even if you’re wrong on the trade, usually you can limit your losses because ultimately the market will reverse and resume the trend.  But, at the same time, which is even more important, it maximizes the potential profit as well. This strategy is included in our complete list of what we believe are the best trading strategies compiled on the internet.

Our team here at Trading Strategy Guides.com only strives to provide you with the best trading strategies.

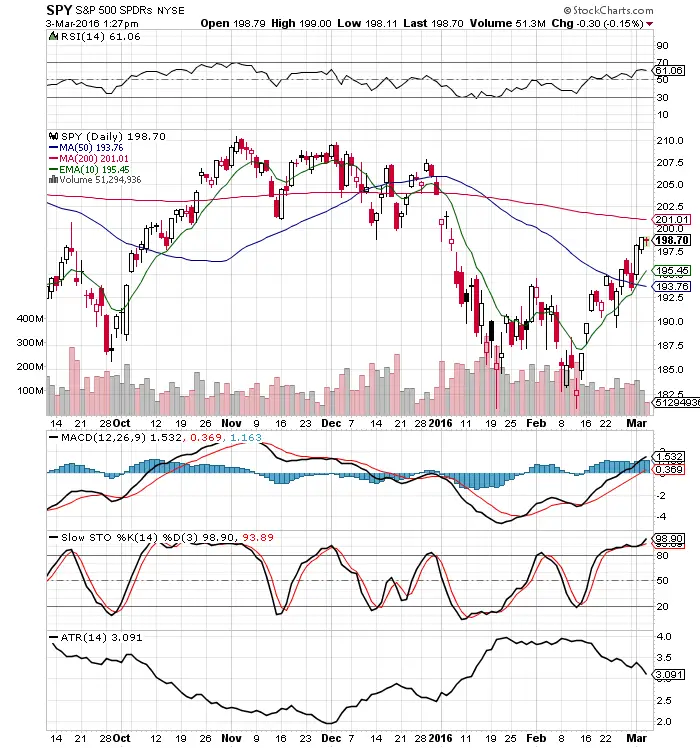
The MACD Trend Following Strategy works best on the higher time frames like the 4h chart or the daily chart. So if you’re a swing trader this is the perfect strategy for you. We have developed this trend following strategy because we felt the need to show the world how to properly use the MACD indicator and to show how accurate this tool can be in forecasting market turning points.

Continue Reading


Reblog: 6 Technical Indicator Signals Basics


Chart Courtesy of StockCharts.comChart Courtesy of StockCharts.com

Signals help traders filter out their opinions and focus on price action. These tools help capture trends in your own time frame.

  1. The 200 day SMA measures the long term trend. Price above long term bullish, prices below signal long term bearish.
  2. The 10 day EMA measures the short term trend. Price above short term bullish, prices below signal short term bearish.
  3. The MACD crossover can signal an intermediate swing trade.
  4. The Slow Stochastics crossovers can signal short term reversals in the trend.
  5. A declining ATR shows volatility decreasing and an ascending ATR shows volatility increasing. This is a signal to help calibrate position sizing.
  6. The RSI shows the risk/reward ratio increasing and decreasing. The 30 RSI favours the bulls risk/reward for entry and the 70 RSI favours the short sellers risk / reward ratio.

The magic of these trading indicators comes when you combine them to create your own trading methodology that fits your own risk tolerance levels and then trade your system with the right risk management and discipline.

The original article is posted by Steve Burns on newtraderu.com and is available here.


Reblog: How to Trade Elliott Wave for Beginners


Before we begin our discussion about how to trade Elliott Wave let’s set the stage by looking at how the Elliott Wave theory was discovered and why Elliott wave strategy is so popular today. In the 1930 R.N. Elliott set out to try to learn more about the stock market after experiencing some losses in the 1929 stock market crash.

Elliott’s discoveries were quite impressive and after careful study of the markets, he began to notice that the market has some repeatable patterns and is trading in a series of five and three waves which is what we call today an Elliott wave strategy.

Our team at Trading Strategy Guides has also adopted the Elliott Wave strategy because it offers us good Elliott Wave entry points which ultimately leads to superior risk to reward ratio.

The Elliott wave strategy is similar to a trend following strategy like the MACD Trend Following Strategy- Simple to learn Trading Strategy or the very popular strategy: How to Profit from Trading Pullbacks.

Even though the Elliott Wave strategy is a trend following strategy, we can spot Elliott Wave entry points even on the lower time frames because the Elliott Wave theory can be applied to all time frames and to all markets so, in essence, is a universal trading strategy.

Now …

Let’s get a little bit deeper into how to trade Elliott Wave and how we can make profits trading.

Continue Reading


Reblog: A Moving Average Trading Strategy That Actually Works


You’ll LOVE today’s lesson because…

I’m going to teach you a Moving Average trading strategy that I’ve been using for years (and no it’s not Moving Average crossover).

In fact:

It’s a “buy low sell high” trading strategy that can be applied to the Forex, Futures, and Stock markets.

I’ll reveal the full details of the trading strategy and leave no stones unturned.

This includes the exact trading setup I look for, entries, exits, and stop loss.

And how you can use this strategy to capture a swing for consistent income or, ride massive trends and grow your wealth over time.

Continue Reading


Reblog: The 6 Stages Of A Trader’s Development Part 1


Stage One: The Clueless Trader

Image result for clueless trader

  1. Heard of a day trader making millions, or buying options is safe and can make you rich quickly
  2. Beginner Luck in first few trades.
  3. You will buy just to see the market reverse and you will short just as the market starts to rally. Someone is tracking my trades and making me lose money.
  4. Most of your trades are done emotionally. You buy just because the markets feel strong without any logical reason
  5. You have no clue how the mechanics and psychology of trading works. What’s worse? You are not aware that you don’t know.
  6. Most traders will blow their entire account multiple at this stage.
  7. Mostly you start your trading in fag end of bull market
  8. You will spend more time finding a broker charging least brokerage.Tracking World Markets, Bitcoins instead of making a trading plan for next day.
  9. A big majority of people will leave trading and blame the randomness of markets, or say markets are always manipulated
  10. You don’t know what is short selling or have never tried it, no idea of stop loss as well
  11. You are in the unconscious incompetence stage, at this stage, your capital is at maximum risk

Continue Reading


Reblog: MACD – How to use the MACD correctly


The MACD is a momentum and trend-following indicator that is based on the information of moving averages and, thus, ideal to act as an additional momentum tool and momentum filter for your trading. In this article, we will explain what the MACD does, how it helps you analyze price and how to use it in your own trading.

First, let’s take a look at the individual components of the MACD indicator:

MACD Line: The MACD line is the heart of the indicator and it’s the difference between the 12-period EMA and the 26 period EMA. This means that the MACD line is basically a complete moving average crossover system in just one line.

Signal Line: The Signal line is the 9-period EMA of MACD Line

MACD Histogram: MACD Line – Signal Line

In this article, we focus on the MACD and the signal line in particular. The histogram is derived from the other two components of the MACD and, thus, don’t add as much explanatory value to overall MACD trading.

Continue Reading