Reblog: 6 Technical Indicator Signals Basics


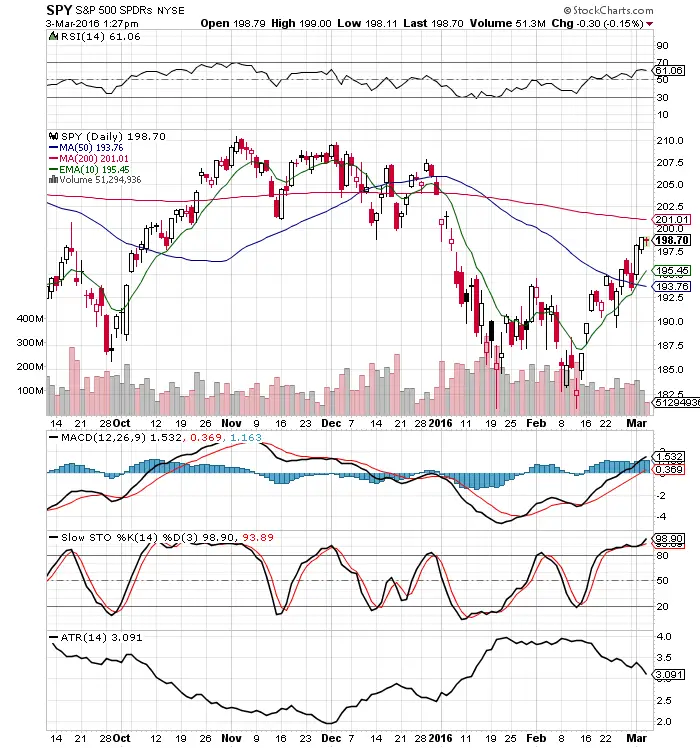 Chart Courtesy of StockCharts.com
Signals help traders filter out their opinions and focus on price action. These tools help capture trends in your own time frame.
- The 200 day SMA measures the long term trend. Price above long term bullish, prices below signal long term bearish.
- The 10 day EMA measures the short term trend. Price above short term bullish, prices below signal short term bearish.
- The MACD crossover can signal an intermediate swing trade.
- The Slow Stochastics crossovers can signal short term reversals in the trend.
- A declining ATR shows volatility decreasing and an ascending ATR shows volatility increasing. This is a signal to help calibrate position sizing.
- The RSI shows the risk/reward ratio increasing and decreasing. The 30 RSI favours the bulls risk/reward for entry and the 70 RSI favours the short sellers risk / reward ratio.
The magic of these trading indicators comes when you combine them to create your own trading methodology that fits your own risk tolerance levels and then trade your system with the right risk management and discipline.
The original article is posted by Steve Burns on newtraderu.com and is available here.