Market Wizard Linda Raschke’s Technical Trading Rules
- Buy the first pullback after a new high. Sell the first rally after a new low.
- Afternoon strength or weakness should have follow through the next day.
- The best trading reversals occur in the morning, not the afternoon.
- The larger the market gaps, the greater the odds of continuation and a trend.
- The way the market trades around the previous day’s high or low is a good indicator of the market’s technical strength or weakness.
Continue Reading →
I wanted a perfect ending. Now I’ve learned, the hard way, that some poems don’t rhyme, and some stories don’t have a clear beginning, middle, and end. Life is about not knowing, having to change, taking the moment and making the best of it, without knowing what’s going to happen next. Delicious Ambiguity.”
–Gilda Radner
In “The Hitchhiker’s Guide to the Galaxy,” author Douglas Adams writes that “we demand rigidly defined areas of doubt and uncertainty.” Nowhere has that become more obvious than in the recent action of stock prices.
Traders and investors now face a delicious ambiguity.
After an extended period of limited daily price changes, volatility and uncertainty have returned to our markets.
Yesterday’s 25-handle move up in the S&P 500 Index continued the pattern of uncertain and almost-random daily large price moves.
Continue Reading →
- Trading with no stop losses. You can’t control how big your profits are, the market will trend as far as it does. However, you can control and limit the size of your losses with a stop loss and a carefully managed positions size. Not having an exit plan if you are wrong can be very expensive when a trend takes off against your position and you start hoping instead of just cutting your losses and moving on.
- Your opinion can cost you money. Trading your opinion against all other market participants can be very expensive. The market goes where it wants and when you disagree with where it is going it will cost you. Going with the flow in your time frame is the best way to make money. Fighting the flow of the market can be expensive.
- Egos are expensive things. Inflated egos cause a trader’s #1 priority to be proving they are right and refusing to admit when they are wrong. It is very expensive for ego gratification to be higher on a trader’s list than making money.
- Trading off predictions can cost a lot of money when they are wrong. There is more to be made by reacting to what the market is doing instead of predicting what you think it will do later. The future does not exist and it is expensive to pretend like it does.
- Stubbornness causes small losses to become big losses. It causes a trader to make the same mistake over and over because they do not assimilate feedback. Instead they keep doing the same thing over and over and expect different results but keep getting the same results. Stubbornness is expensive.
- Not having an exit strategy for a winning trade can be very expensive. It is possible to ride a big winning trade back to even. If there is no plan to lock in profits while they are there a winning trade can even turn into a big loser. Trailing stops and targets can put the profits in the bank.
- Trading too big of position sizes for your account can be very costly because no manner how good your winning trades are you are set up to give back the profits with a few big losing trades in a row.
The original article posted by Steve Burns appears on newtraderu.com and is available here.
Bullish engulfing, as well as, bearish engulfing are two of the most powerful price action candlestick patterns. I have mentioned them briefly in my Candlesticks article, but now I want to put more emphasis on those two. More than that- bullish engulfing and bearish engulfing patterns are deeply ingrained in my trading strategy. Let’s explore what those two candlestick price action patterns can help us achieve.
INTRODUCTION– Bullish Engulfing and Bearish Engulfing- Probably The Best Price Action Candlestick Patterns
This article will be divided into two parts- first part will deal with the bullish engulfing pattern; the second part will go over the bearish engulfing candlestick pattern. History repeats itself, so I believe that the best way to read the market is to know what happened in the past. Bullish engulfing patterns are a confirmation that more buyers want to join the uptrend. On the other side, a bearish engulfing pattern gives confirmation for more sellers joining the short side. Let’s move to the first part- the bullish engulfing candlestick pattern.
PART 1– Bullish Engulfing Candlestick and Price Action
What is a candlestick?
Before I move to the real part, I would like to remind you once again what is a candlestick.
A candlestick contains an instrument’s value at open, high, low and close of a specific time interval.
Let’s say we are looking at a daily candlestick. It does contain the value at open, high, low and close on any particular day.
Continue Reading →
Choose the correct line?
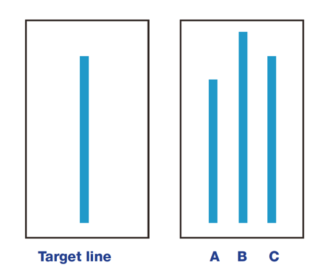
Let me start by asking you a simple question?
In the above diagram, which of the three lines numbered A,B and C is closest in length to the target line ?
If you answered C, congrats that is the right answer!
Of course, it was outrageously obvious right.
Now before you swear at me for insulting your intelligence, here is the shocker – in a famous experiment conducted in the 1950’s, for the same question majority of the people chose the wrong line.
But how could this be?
Were they actually that dumb..
Enter behavioural economics. Unknown to the participants, there was a secret behavioural trick played on these people which caused them to choose the wrong answer despite the correct answer being very obvious to them.
Continue Reading →
In 1995, Pixar was on a rocket ship growth trajectory.
Toy Story came out in November of that year to rave reviews and made more money than almost anyone thought was imaginable. It was the first full-length animated film done entirely using CGI and ended up grossing over $360 million worldwide.
The team at Pixar was feeling pretty good about themselves, but Steve Jobs was already planning on the company’s first failure. He convinced the company’s co-founder Ed Catmull that eventually they would make a film that flopped at the box office. To prepare themselves for this eventuality, Jobs pushed the private company to go public to secure funding that could prepare Pixar for a dud at the box office.
Jobs made the case that increasing the capital base would allow the firm to fund their own projects to give them more of a say in how they moved forward creatively. But it would also prepare them financially for a future failure. He argued it made no sense to depend solely on the performance of each new release to keep the ship afloat.
Catmull described his feelings about this idea in his excellent book, Creativity Inc.:
Continue Reading →
Where do our greatest trading mistakes come from while we are trading the financial markets? They arise primarily from within. It is not the price action that causes our missteps and mistakes but our response to the price action.
- Your ego will cause you to allow a small loss to grow into a big loss because you do not want to be made wrong by exiting with a loss. Ego wants to hold on until you can at least get back to even. Not locking in a loss but holding it until it gets back to even gives the ego some gratification. This is also what creates many resistance levels at old support when people are given a second chance to get out at even.
- Trading what you think is going to happen instead of what is happening can keep people on the wrong side of trends for days, weeks, and months. Imposing your own opinions on price action instead of following it can cause big losses or to miss big trends while think the market is wrong and we are right.
Continue Reading →

At the risk of sounding philosophical, cultivate a healthy sense of detachment from your portfolio and markets. Photo: Bloomberg
An inescapable facet of being a relative return fund manager is that your performance is always measured against a benchmark index. A layperson may not take it kindly if they are asked, “How’s your performance?” But we fund managers are quite used to the question and the words underperformance and outperformance, though not very common in everyday usage, are quite common in the money management lexicon.
Equally inescapable is the fact that every fund manager, however good, will go through phases of underperformance, i.e. their fund’s returns will be lesser than the benchmark index. The only known exception to this was possibly Bernie Madoff but we all know how that ended. Not even Warren Buffett has escaped this truth. In fact, he puts a simple table with Berkshire Hathaway’s per share book value growth and S&P index returns on the first page of every annual letter that he writes to shareholders. The 2017 letter shows that in six out of the past 10 years, Berkshire’s book value growth underperformed the S&P 500 and yet nobody would debate the fact that the cumulative return, both absolute and relative, over many decades has been astounding. However an average investment committee whose patience generally wears thin after a couple of consecutive years of underperformance would have sacked Buffett as a fund manager thrice in his career. Not having an investment committee breathing down his neck is perhaps Buffett’s biggest competitive advantage.
Lesser mortals though have to play this relative performance game and the unfortunate part is that index returns can be computed for all time periods from minutes to decades. I vividly recall a conversation with a fellow fund manager who was lamenting that he was already down 25 basis points against the index and it was only 10.30 in the morning.
Availability bias means that what’s measurable will be measured, irrespective of whether it is signal or noise. There are a few tell-tale symptoms of a fund manager who is underperforming even if it’s for a short period of time, like a few months. The first symptom is obsession with daily relative performance. Waking up bleary eyed to check this first thing in the morning is the most common sign. An extension of this is an unhealthy obsession with the performance of one’s peer group funds. Once done checking your own fund’s net asset value (NAV), you go through the NAV of your peer group funds to see if they are doing better or worse. This also morphs into obsession with peer group portfolios and who is buying or selling what.
Another symptom is to dissect index returns and focus too much on stocks that are in the index and have done well over the last few months. While being sure of why you don’t own a certain stock is important, spending too much time analysing stocks and sectors just because they have done well in the recent past will lead to biases. Shying away from investor communication is another sign. This is true not only for underperforming fund managers but also for companies which are going through a soft patch in their business cycle. All of us know of companies that are on multiple business news channels and investor roadshows when the going is good, but go into a shell when things turn for the worse. Loss of productivity due to fleeting attention span, given the pre-occupation with price movements and a constant state of irritability, that in an advanced stage leads to viewing everything negative through lens of a conspiracy theory are some of the other pitfalls.
The symptoms might seem formidable and yet you are not the first fund manager to exhibit them. Through self-observation and learning from seasoned investors who have seen these cycles multiple times, there are a few hacks to better contend with the symptoms. The one that helps most is knowing your investment style. Every fund manager should be able to clearly articulate in what kind of a market environment their style would work and when it wouldn’t. This should be mandatory material in every marketing pitch and should be emphasized, especially in the good times.
In times when the portfolio is underperforming the index, having this clarity can give tremendous confidence. Buffett alluded to this quite early in his investing journey. In his second annual letter to limited partners written in 1957, he said: “Our performance, relatively, is likely to be better in a bear market than in a bull market… In a year when the general market had a substantial advance, I would be well satisfied to match the advance of the averages.”
Rather than staring at the screen, a better use of time is to revisit the rationales you had written while buying the stocks in your portfolio and see if they are still valid. Engage with management teams again to ensure that your conviction still holds and weed out names where the original thesis is not playing out. Also, this should be a time when you pro-actively communicate with your investors and re-emphasize your style. It is important to know that your investors derive comfort from your confidence and getting into a shell in such times is detrimental.
Lastly, at the risk of sounding philosophical, cultivate a healthy sense of detachment from your portfolio and markets. This does not mean you abdicate responsibility but it means that you should be able to prevent the symptoms from taking over all your waking moments. All this is obviously easier said than done and this is much more a note to self rather than a sermon for anybody else. But if this helps a fellow investor cope with the symptoms even slightly better, it would have more than served its purpose.
Swanand Kelkar is managing director at Morgan Stanley Investment Management. These are his personal views. The article appeared on livemint.com and is available here.
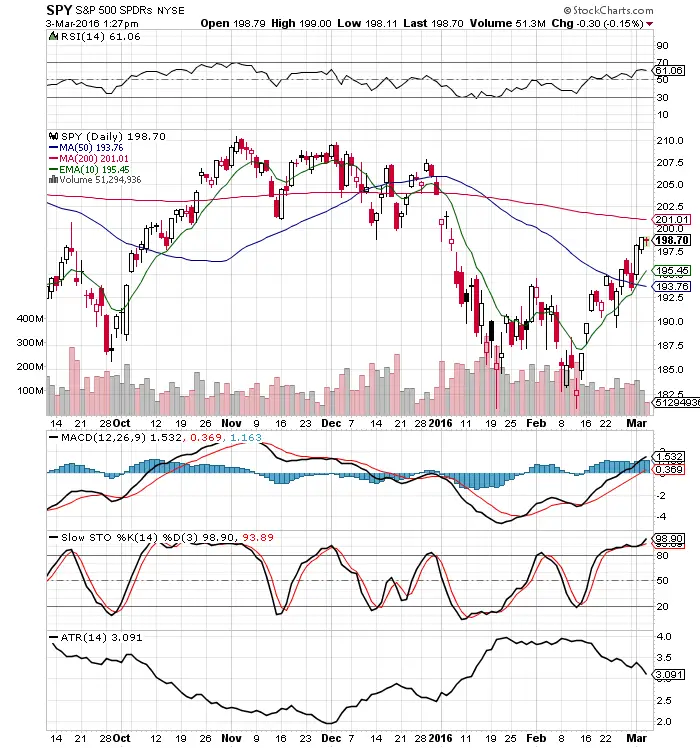 Chart Courtesy of StockCharts.com
Signals help traders filter out their opinions and focus on price action. These tools help capture trends in your own time frame.
- The 200 day SMA measures the long term trend. Price above long term bullish, prices below signal long term bearish.
- The 10 day EMA measures the short term trend. Price above short term bullish, prices below signal short term bearish.
- The MACD crossover can signal an intermediate swing trade.
- The Slow Stochastics crossovers can signal short term reversals in the trend.
- A declining ATR shows volatility decreasing and an ascending ATR shows volatility increasing. This is a signal to help calibrate position sizing.
- The RSI shows the risk/reward ratio increasing and decreasing. The 30 RSI favours the bulls risk/reward for entry and the 70 RSI favours the short sellers risk / reward ratio.
The magic of these trading indicators comes when you combine them to create your own trading methodology that fits your own risk tolerance levels and then trade your system with the right risk management and discipline.
The original article is posted by Steve Burns on newtraderu.com and is available here.
 Investing isn’t, and can’t be, about soothsaying market levels or about technical `timing’ of the markets. It also is not about finding that next new `wave’, `mega theme’ or `grand’ strategy; nor is it about dwelling on national or global economic macros.Investing remains a simple, rather dull and boring, uncluttered practice of bottom-up stock picking, with painstaking efforts and arduous discipline.
The rest are popular sports, meant for amusement, occasional applause but not for adoption. If the investing skills were to degenerate to mere predicting of market levels and, hoisting the investing boat just at the right point of time such that rising tide lifts the boat, it would have been an embarrassing branch of knowledge. But fortunately , it is not.
Capital preservation and capital appreciation remain the pillars and cornerstone objectives of a good investing philosophy. While both are almost equally important, preservation precedes appreciation. That precedence has a telling effect on investing philosophy and strategy conceptualisation.
Continue Reading →