- HMTL is a versatile digital business, product engineering and infra management solution provider company.
- It has established its niche with the successful execution of customer-centric developments.
- HMTL has posted the growing pattern for its top and bottom lines.
Based on Q1 FY21 parameters, the issue is lucratively priced.
PREFACE:
Ashok Soota and his group have incorporated this company. It is well known that earlier Ashok Soota emerged as the leader and instrumental in the growth of MindTree which was incorporated in August 1999. Subsequently, this company was taken over by L & T group in the year 2019. Ashok Soota exited this company in 2010 itself and parted with his stake in the company to other founders.
ABOUT COMPANY:
Happiest Minds Technologies Ltd. (HMTL) is claiming to have been positioned as “Born Digital. Born Agile”. It focuses on delivering a seamless digital experience to its customers. HMTL’s offerings include, among others, digital business, product engineering, infrastructure management and security services. Its capabilities provide an end-to-end solution in the digital space. The company believes that it has developed a customer-centric focus that aims to fulfil their immediate business requirements and to provide them strategically viable, futuristic and transformative digital solutions.
HMTL helps customers in finding new ways to interact with their users and clients enabling them to become more engaging, responsive and efficient. It also offers solutions across the spectrum of various digital technologies such as Robotic Process Automation (RPA), Software-Defined Networking/Network Function Virtualization (SDN/NFV), Big Data and advanced analytics, Internet of Things (IoT), cloud, Business Process Management (BPM) and security.
As of June 30, 2020, HMTL had 148 active customers. Its repeat business (revenue from existing customers) has steadily grown and contributed a significant portion of its revenue from contracts with customers over the years indicating a high degree of customer stickiness. The company believes its agility and resilience has stood out in recent years. In the three months ended June 30, 2020, and in Fiscal 2020, it delivered 90.1% and 87.9% respectively of projects through the agile delivery methodology. Over the years and currently, during the ongoing outbreak of Novel Coronavirus, it has successfully implemented business continuity plans including to achieve efficient work-from-home practices to ensure connectivity across the enterprise.
As of March 31, 2020, HMTL had a Glassdoor rating of 4.1 on a scale of ‘1- 5’, among the highest for Indian IT services companies (Source: Frost & Sullivan Report). The Company has been recognized and rewarded. In the Great Place to Work® survey for 2019, it has been ranked fourth in IT services, in India’s Top 25 Best Workplaces for IT & IT-BPM and among India’s Top 25 Best Workplaces for Women.
ISSUE DETAILS / CAPITAL HISTORY:
To part finance its long term capital requirements (Rs. 101 cr.) and general corpus funds, HMTL is coming out with a maiden IPO with a combo offer of fresh equity issue (Rs. 110 cr.) and offer for sale. It consists fresh equity issue of approx 6626505 shares of Rs. 2 each and an offer for sale of 35663585 shares. The issue opens for subscription on September 07, 2020 and will close on September 09, 2020. The company has fixed the price band of Rs. 165 – Rs. 166 per share. Minimum application is to be made for 90 shares and in multiples thereon, thereafter. Post allotment, shares will be listed on BSE and NSE. HMTL mulls mobilizing around Rs. 697.79 – Rs. 702.02 cr. (based on lower and upper price bands) through this IPO. Issue constitutes 28.80% of the post issue paid-up capital of the company.
Having issued initial equity at par, the company raised further equity in the price range of Rs. 3 to Rs. 26. It has also issued bonus shares in the ratio of 162 for 1 (Nov. 2011). The company also converted preference shares into equity in the ratio of 163 for 1 (in March 2020, May 2020 and July 2020). Preference shares were having a face value of Rs. 652 per share and were issued in the price range of Rs.4890, Rs. 5500, Rs. 5930, Rs. 6150, Rs. 6700 and Rs. 11410 per share between October 2011 and April 2018.
The average cost of acquisition of shares by the promoters/ selling stakeholders is Rs. 24.91 and Rs. 34.68 per share. Post issue HMTL’s current paid-up equity capital of Rs. 28.05 cr. will stand enhanced to Rs. 29.37 cr. With this IPO, HMTL is looking for a market cap of Rs. 2437.94 cr. approx. The issue is jointly lead managed by ICICI Securities Ltd. and Nomura Financial Advisory and Securities (India) Pvt. Ltd. while KFin Technologies Pvt. Ltd. is the registrar to the issue.
FINANCIAL PERFORMANCE:
On the financial performance front, on a consolidated basis, HMTL has posted revenue/net profits (Loss) of Rs. 489.12 cr. / Rs. – (22.47) cr. (FY18), Rs. 601.81 cr. / Rs. 14.21 cr. (FY19), Rs. 714.23 cr. / Rs. 71.71 cr. (FY20). For Q1 of FY21, it has earned a net profit of Rs. 50.18 cr. on revenue of Rs. 186.99 cr. Thus after FY19, it has posted growth in revenue as well as net profits.
On a consolidated basis, for the last three fiscals, HMTL has posted an average EPS of Rs. 2.55 and an average RoNW of 3.1%. Based on HMTL’s NAV of Rs. 23.7 as on June 30, 2020, issue is priced at a P/BV of 7 (on the basis of upper cap).
If we annualize the latest FY21-Q1 results (with super-profits) and attribute it on fully diluted equity post IPO, then asking price is at a P/E of around 12 against the industry average of 27. On the basis of its trailing earnings and paid-up equity as on March 31, 2020, the issue is priced at a P/E of around 31. Management attributed the rise in net profit for Q1-FY21 for their ongoing cost-cutting as well as rent reduction for its staffing parks, following the work from home strategy. Despite pandemic, they had around 77% business running smoothly and yielding rewards. Management is confident of maintaining reasonable growth in their net earnings.
BRLM’s TRACK RECORD:
The two Book Running Lead Manager’s (BRLM’s) associated with this offer have handled 11 public issues in the past three years, out of which 5 closed below the issue price on listing date.
COMPARISION WITH LISTED PEERS:
As per offer documents, HMTL has shown TCS, Infosys, LTI and MindTree as its listed peers. They are currently quoting at a P/Es of around 27.5, 24.37, 27.52 and 25.04 (as on September 02, 2020). However, they are not strictly comparable on an apple to apple basis.
Conclusion / Investment Strategy
Based on financial parameters, the issue appears fairly priced with something on the table. The company has adopted a mindful IT strategy for its future growth. Investors may consider subscribing this IPO for medium to long term rewards.
The original review is authored by Dilip Davda, appears on Chittorgarh.com and is available here.

ABOUT COMPANY:
Rossari Biotech Ltd. (RBL) is one of the leading specialty chemicals manufacturing companies in India. It is providing customized solutions to specific industrial and production requirements of customers that are primarily in FMCG, apparels, poultry and animal feed industries. RBL has well-diversified activities and has a vast product portfolio comprising home, personal care and performance chemicals, textile specialty chemicals, animal health and nutrition products. Besides India, the company’s operation is spread across 17 foreign countries. According to the F & S Report, as on 30th September 2019, RBL is the largest manufacturer of textile specialty chemicals in India and it providing textile specialty chemicals in a sustainable, eco-friendly yet competitive manner. As on May 31, 2020, it had a wide range of 2030 different products (consisting of 1543 products for textile specialty chemical alone).
The company derives 46.81% of its total revenues from its home, personal care and performance chemicals, 43.71% from textile specialty chemicals and the rest from animal feeds and nutrition products. To stay tuned with the time and demand of its customers, RBL keeps monitoring the fast-changing trends across the segment it deals with. The company enjoys a long term relationship with most of its top customers. In domestic markets, the company’s client list includes HUL, Arvind Ltd., Raymonds, Panasonic, IFB, Bosch, etc.
The company has its R & D facilities with two most modern facilities in the western region. As on 31st May 2020, it has a network of 204 distributors for the domestic market and 29 distributors across the 17 countries and two international offices in the primary markets of its reach.
Continue Reading →
CY 2020 started with the main-board IPO of ITI Ltd. that failed to garner the desired amount despite extension and change in the price band. However, SBI Card IPO created unprecedented hype ever since it filed DRHP with regulator and surprised one and all with hectic grey market premium activities even before the announcement of the price band, lot size etc. Anyway, since this IPO is currently the “Talk of the Town” and is attracting fancy across the board, it is expected to make new records of oversubscription opines primary market experts. But they cautioned that “Please do not be carried away with grey market activities, investors must study the fundamentals before investing.”
ABOUT COMPANY
SBI Cards and Payment Services Ltd. (SBI Card) a subsidiary of SBI is one of the leading credit card issuers in India, which is one of the fastest-growing economies in the world with an expanding and under-penetrated credit card market. As per the survey, India has just 3% penetration (lowest in the world) in the credit card segment leaving ample scope for advancement.
SBI Card is the second-largest credit card issuer in India, with a 17.6% and 18.1% market share of the Indian credit card market in terms of the number of credit cards outstanding as of March 31, 2019, and November 30, 2019, respectively, and a 17.1% and 17.9% market share of the Indian credit card market in terms of total credit card spends in fiscal 2019 and in the eight months ended November 30, 2019, respectively, according to the RBI. It offers an extensive credit card portfolio to individual cardholders and corporate clients which include lifestyle, rewards, travel and fuel, shopping, banking partnership cards and corporate cards covering all major cardholder segments in terms of income profiles and lifestyles.
It started operations in 1998, and since then SBI’s parentage and highly trusted brand have allowed it to quickly establish a reputation of trust, reliability and transparency with cardholders. According to the RBI, SBI Card has grown its business faster than the Indian credit card market over the past three years both in terms of numbers of credit cards outstanding and amounts of credit card spends. From March 31, 2017, to March 31, 2019, its total credit card spends grew at a 54.2% CAGR (as compared to a 35.6% CAGR for the overall credit card industry, according to the RBI) and the number of its credit cards outstanding grew at a 34.5% CAGR (as compared to a 25.6% CAGR for the overall credit card industry, according to the RBI).
It has a broad credit card portfolio that includes SBI Card-branded credit cards as well as co-branded credit cards that bear both the SBI Card brand and co-brand partners’ brands. It offers four primary SBI branded credit cards: SimplySave, SimplyClick, Prime and Elite, each catering to a varying set of cardholder needs. It is also the largest co-brand credit card issuer in India according to the CRISIL Report and has partnerships with several major players in the travel, fuel, fashion, healthcare and mobility industries, including Air India, Apollo Hospitals, BPCL, Etihad Guest, Fbb, IRCTC, OLA Money and Yatra, among others. Its credit cards portfolio is tailored to meet a diverse range of cardholder needs across the entire spectrum of its cardholders’ income profiles and lifestyles, from the “premium” cardholder category to the “affluent”, “mass affluent”, “mass” and “new to credit” categories. The company issues credit cards in partnership with the Visa, MasterCard and RuPay payment networks, and is continuously looking to expand its payment network partnerships to broaden the reach and functionality of credit card offerings.
It has a diversified customer acquisition network that enables it to engage prospective customers across multiple channels. It deploys a sales force of 32677 outsourced sales personnel as of December 31, 2019, operating out of 145 Indian cities and which engages prospective customers through multiple channels, including physical points of sale in bank branches, retail stores, malls, fuel stations, railway stations, airports, corporate parks and offices, as well as through telesales, online channels, email, SMS marketing and mobile applications. SBI Card is the leading player in open market customer acquisition in India according to the CRISIL Report. It has a presence in 3190 open market points of sale across India as of December 31, 2019. Also, its partnership with SBI provides with access to SBI’s extensive network of 21961 branches across India, which enables it to market credit cards to SBI’s vast customer base of 445.5 million customers as of December 31, 2019.
Its technology systems also leverage artificial intelligence and process automation technologies to automate routine activities, such as customer service and credit analysis, which have enhanced its operating efficiencies. It has a diversified revenue model whereby it generates both non-interest income (primarily comprised of fee-based income such as interchange fees, late fees and annual fees, among others) as well as interest income on its credit card receivables. The share of its revenue from operations that derive from non-interest income has steadily increased over the past three fiscal years, from 43.6% in fiscal 2017 to 48.9% in fiscal 2019.
ISSUE DETAILS / CAPITAL HISTORY
Currently, SBI group is holding 74% and CA Rover Holdings (26%) equity of SBI Card. To part finance augmenting its capital base to meet future capital requirements, SBI Card is coming out with a maiden combo IPO of fresh equity issue (FV ₹10) as well as offer for sale. SBI Card is issuing fresh equity share shares worth ₹500 cr. (approx 6,622,516 shares) and an offer for sale of 130,526,798 shares. It has fixed the price band of ₹750 – ₹755 and thus mulls mobilizing ₹10,286.20 cr. to ₹10,354.77 cr. (based on lower and upper price bands). The offer includes a reservation of up to 1,864,669 shares for subscription by eligible employees and a reservation of 13052680 shares for subscription by SBI Shareholders (who are holding SBI shares in their demat account on 18.02.2020). The company is offering a discount of ₹75 per share to eligible employees. There is no discount for any other category.
The issue opens for subscription on 02.03.2020 and will close on 04.03.2020 for QIB Bidders and 05.03.2020 for all other categories of bidders. Minimum application is to be made for 19 shares and in multiples thereon, thereafter. Post allotment, shares will be listed on BSE and NSE. Issue constitutes approx. 14.61% of the post issue paid-up capital of the company.
Having issued initial equity at par, SBI Card raised further equity (52,222,222 shares) by way of the rights issue at a fixed price of ₹90 per share in July 2018 and then issued further equity (95,112,054 shares) in July 2019 on an amalgamation of SBI Business Process.
The average cost of acquisition of Equity Shares for the selling shareholders is in the range of ₹28.69 to ₹81.19 per Equity Share and the offer price at the upper end of the Price Band is ₹755 per equity share. The company will spend less than 1.5% for the overall IPO process.
Post issue, SBI Card’s current paid-up equity capital of Rs.932.33 cr. will stand enhanced to ₹938.95 cr. With this issue, SBI Card is looking for a market cap of approx. ₹70890 cr.
BRLM’s to this offer are Kotak Mahindra Capital Company Ltd., Axis Capital Ltd., DSP Merrill Lynch Ltd., HSBC Securities and Capital Markets (India) Pvt. Ltd., Nomura Financial Advisory and Securities (India) Pvt. Ltd. and SBI Capital Markets Ltd. Link Intime India Pvt. Ltd. is the registrar to the issue.
FINANCIAL PERFORMANCE
For the last three fiscals, SBI Card has reported total revenue/net profits of ₹3471.04 cr. / ₹372.86 cr. (FY17), ₹5370.19 cr. / ₹601.14 cr. (FY18) and ₹7286.84 cr. / ₹862.72 cr. (FY19). For nine months period ended on 31.12.19, it has earned a net profit of ₹1161.21 cr. on revenue of ₹7240.16 against a net profit of ₹614.52 cr. on revenue of ₹5278.68 cr. for the corresponding previous period.
For the last three fiscals, SBI Card has posted an average EPS of ₹7.97 and an average RoNW of 24.67%. The issue is priced at a P/BV of 14.60 based on its NAV of ₹51.73 as on 31.12.19. If we annualize latest earnings and attribute it on fully diluted equity post IPO then asking price is at a P/E of around 45.8 making it fully priced issue.
For FY17 to FY19 SBI Card has reported CAGR of 44.6% in revenues, 37.6% in interest income, 53.2% in non-interest income and 52.1% in profit after tax (PAT). With continuing leveraging technology SBI Card all set for expanding customer acquisition capabilities, stimulate growth in credit card transaction volumes and enhance cardholders experience and broadening its portfolio with more tie-ups.
COMPARISION WITH LISTED PEERS
As per offer documents, SBI Card has no listed peers to compare with.
BRLM’S TRACK RECORDS
The six merchant bankers associated with the offer have handled 46 issues in the past three financial years, out of which 17 issues closed below the issue price on listing date.
MAJOR CONCERNS
Any unfavorable change in Government/RBI policy for MDR (Merchant Discount Rate) and unsecured financing pattern are major concerns. Its dependence on SBI and the rising market competition may pose threats.
Conclusion / Investment Strategy
SBI Card enjoys fancy due to parent SBI’s credentials. Being a second-largest plastic money player in a growing economy like India and the first mover in the segment to get listed, it may continue to generate high interest going forward. Although the issue appears fully priced, investors may consider investment for short to long term rewards.
The original review is written by Dilip Davda, appears on chittorgarh.com and is available here.

IPO Snapshot:
Prince Pipes is entering the primary market on Wednesday 18th December 2019, to raise Rs. 500 crore, via an IPO of equity shares of Rs. 10 each, comprising fresh issue of up to Rs. 250 crore and an offer for sale (OFS) of up to Rs. 250 crore by promoters, in the price band of Rs. 175-178 per share. Issue, split 50:15:35 among institutional, HNI and retail investors respectively, represents 26% of the post-issue share capital and will close on Friday 20th December, with listing likely on 31st December.
Company Background:
Prince Pipes is a 30 year old, family run business, making polymer pipes and fittings at 6 plants (in Silvasa, Haridwar, Kolhapur, Chennai, Rajasthan) with total installed capacity of 2.4 lakh tonne per annum (TPA) while production capacity is assessed at 1.9 TPA. While Rajasthan plant is new (started in Q2FY20), its installed capacity is being expanded from current 6,221 TPA to 17,021 TPA by Dec 2019 and to 20,909 TPA by FY20-end. Company also plans a 51,943 TPA greenfield facility at Telangana, likely to be operational by Dec 2020, implying 28% capacity hike in the next 18 months. About less than 10% of production is also outsourced to 5 contract manufacturers (in Aurangabad, Guntur, Odisha and Bihar) as logistics cost are vital, given the bulky nature of products. Company markets its products pan-India under brands Prince and Trubore, via 1,027 distributors. Going forward, it plans to focus on plumbing and drainage segments and less on irrigation, given latter’s lower margins.
Continue Reading →
- USFB is the second-largest SFB in India.
- It has shown growth in its business for the last three fiscals.
- Issue pricing appears reasonable against listed peers.
- Pre-IPO placement worth Rs. 299.19 cr. done at Rs. 35 per share in Nov. 19.
- UFSL shareholder quota offered at a discount of Rs. 2 per share against IPO pricing of Rs. 37 (upper band).
ABOUT COMPANY:
Ujjivan Small Finance Bank (USFB) is a mass-market focused SFB in India, catering to unserved and underserved segments and committed to building financial inclusion in the country. Its Promoter, UFSL (Ujjivan Financial Services Ltd.) commenced operations as an NBFC in 2005 with the mission to provide a full range of financial services to the ‘economically active poor’ who were not adequately served by financial institutions. UFSL’s erstwhile business was primarily based on the joint liability group-lending model for providing collateral-free, small ticket-size loans to economically active poor women. UFSL also offered individual loans to Micro and Small Enterprises (“MSEs”) and adopted an integrated approach to lending, which combined a customer touchpoint similar to microfinance, with the technology infrastructure and related back-end support functions similar to that of a retail bank. On October 7, 2015, UFSL received RBI In-Principle Approval to establish an SFB (Small Finance Bank), following which it incorporated Ujjivan Small Finance Bank Limited as a wholly-owned subsidiary. UFSL, after obtaining RBI Final Approval on November 11, 2016, to establish and carry on business as an SFB, transferred its business undertaking comprising of its lending and financing business to USFB, which commenced its operations from February 1, 2017. The bank is included in the second schedule to the Reserve Bank of India Act, 1934 as a scheduled bank on July 3, 2017. In the short period that it has been operational as an SFB, it is among the leading SFBs in India in terms of deposits, advances, branch count and geographical spread, as of March 31, 2019.
Continue Reading →
The following is an excerpt from Barton Bigg’s book, Hedgehogging, where he relates a conversation with “Tim”, a successful macro investor (emphasis mine).
Tim works out of a quiet, spacious office filled with antique furniture, exquisite oriental rugs, and porcelain in a leafy suburb of London with only a secretary. My guess is he runs more than $1 billion, probably half of which is his. On his beautiful Chippendale desk sits a small plaque, which says totis porcis—the whole hog. There is also a small porcelain pig, which reads, “It takes Courage to be a Pig.” I think Stan Druckenmiller, who coined the phrase, gave him the pig.
To get really big long-term returns, you have to be a pig and ride your winners… When he lacks conviction, he reduces his leverage and takes off his bets. He describes this as “staying close to shore… When I asked him how he got his investment ideas, at first he was at a loss. Then, after thinking about it, he said that the trick was to accumulate over time a knowledge base. Then, out of the blue, some event or new piece of information triggers a thought process, and suddenly you have discovered an investment opportunity. You can’t force it. You have to be patient and wait for the light to go on. If it doesn’t go on, “Stay close to shore.”
What separates the great traders from those who are just good?
The answer is knowing when to size up and eat the whole hog.
Let me explain.
Continue Reading →
Whether you are a price action, a pattern, an indicator or whatever trader, if you are able to identify strong price levels on your charts, it can greatly improve the quality of your trading.
Instead of taking signals and trades all over the place, the better trades usually happen at key price levels. Those strong areas of interest show that buyers and sellers are concentrating at those levels and they can be the starting or turning points for new price moves and mark new trends as well.
If you are a breakout trader, you need to find areas that can lead to strong breakouts, if you are a trend-following trader you must identify pullback areas or trend continuation points, a reversal trader looks for key turning points and a range trader should focus on well-developed ranges with clearly defined price levels.
Continue Reading →
If you want to trade macro, you need to understand liquidity.
PTJ, Druck, Soros, Dalio — all these legends have expressed this fact multiple times.
Liquidity is what moves markets.
This is even more true now than in the macro heydays of the 70s and 80s.
With the rise of “blind investing” in the form of passively buying and holding ETFs, the majority of investors don’t care about valuation or merit. They just auto-shuttle their excess funds to the nearest robo advisor without a second thought.
This amount of “excess funds” is largely dependent on liquidity conditions.
When liquidity is loose, it’s cheap to get levered. People have extra cash and plow it into risk assets. Prices rise.
When liquidity is tight, people have less cash to spend. They may even sell stuff to service their existing debt. Prices fall.
There are a myriad of ways to measure and monitor liquidity conditions.
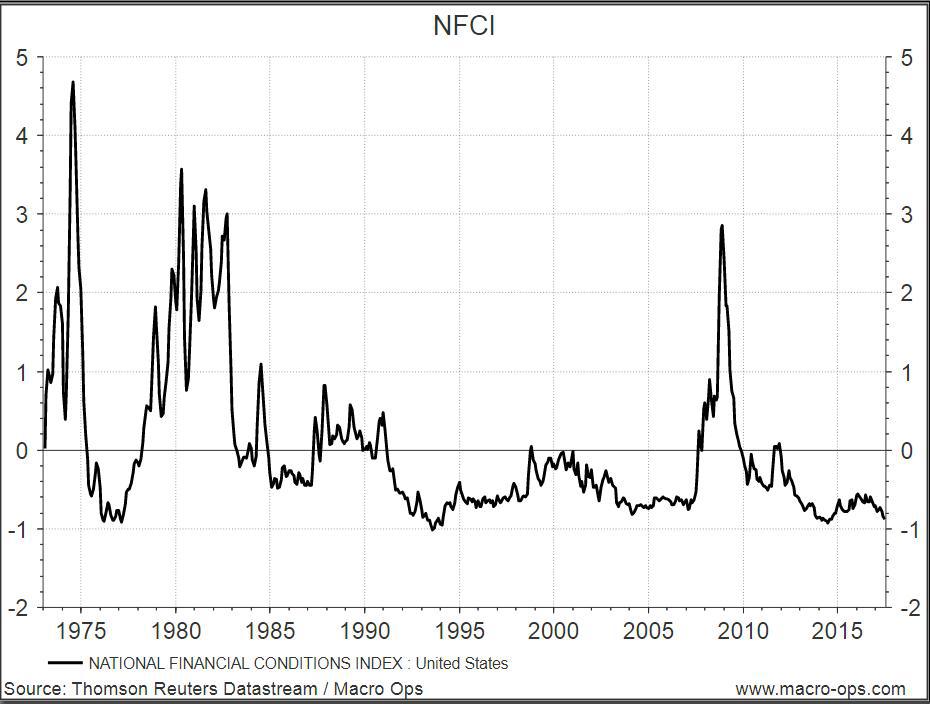
No single method is best, but one of our favourites is using the Chicago Fed’s National Financial Conditions Index (NFCI).
This index combines over 105 different indicators of financial activity to form one easy-to-read liquidity measurement. Money markets, debt markets, equity markets, traditional banking systems, “shadow” banking systems — they’re all included.
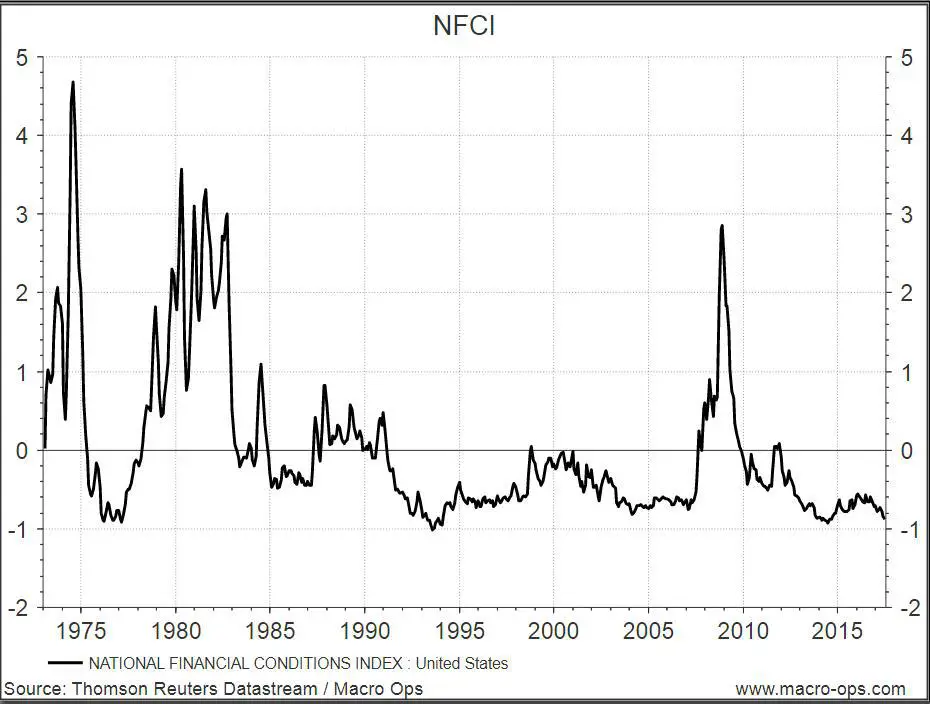
The zero line represents average liquidity conditions. Positive values indicate tighter-than-average conditions and negative values indicate looser-than-average conditions.
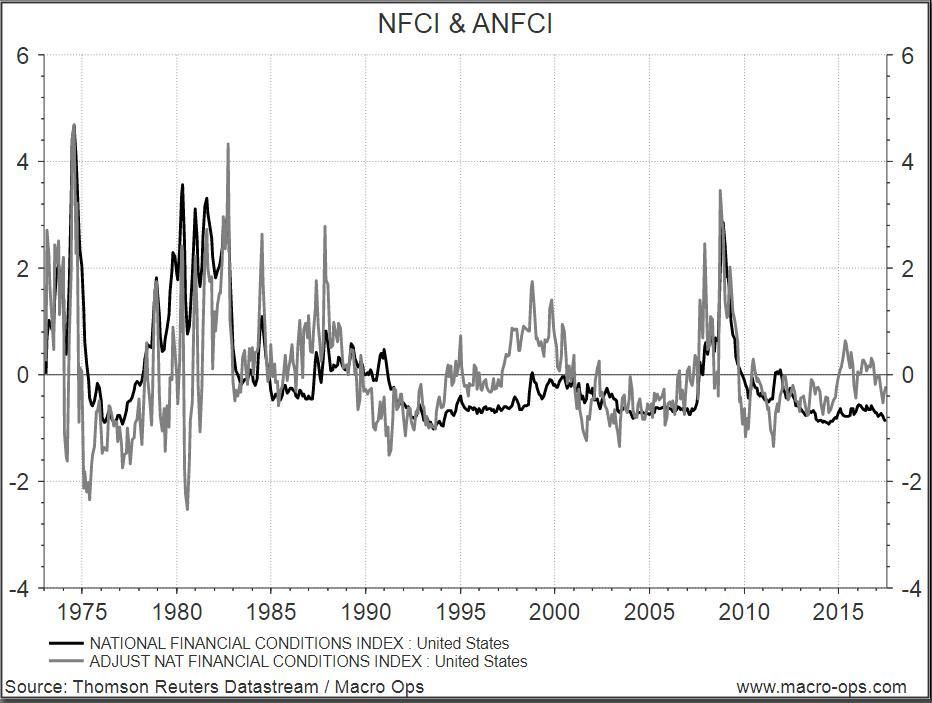
The Chicago Fed also publishes the Adjusted National Financial Conditions Index (ANFCI).
Since financial liquidity conditions are highly correlated to economic conditions, this index isolates the uncorrelated component. It tells us what liquidity conditions are like relative to economic conditions.
Positive values indicate liquidity conditions are tighter than would be suggested by current economic conditions, while negative values indicate the opposite.
You can see the difference between the standard and adjusted index in the graph below.
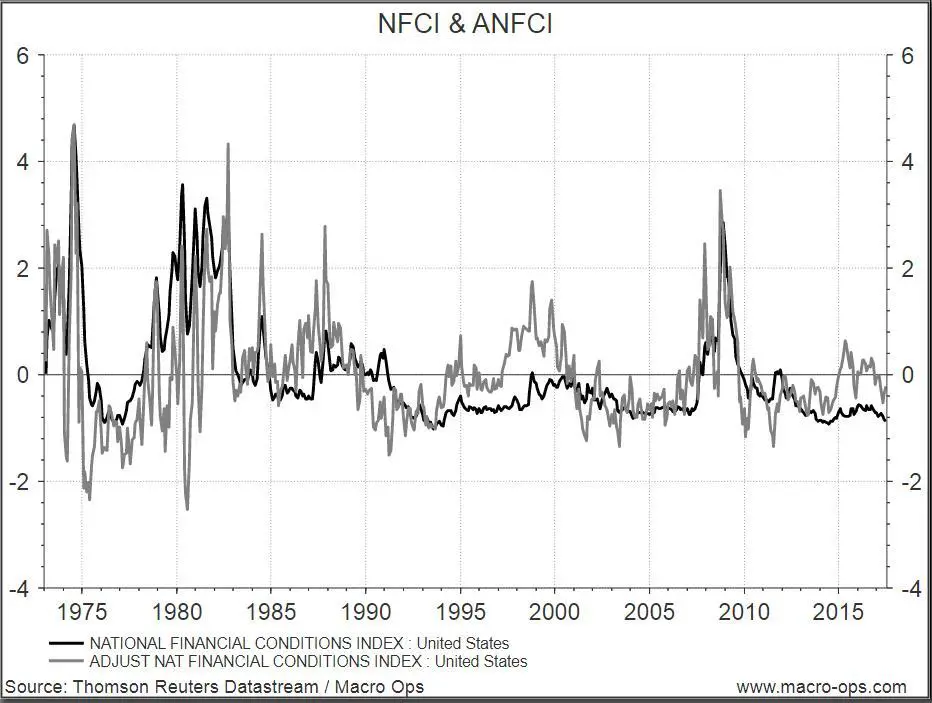
We prefer the ANFCI because it isolates liquidity conditions better than the NFCI.
The NFCI doesn’t always tell you when liquidity is deteriorating. In the late 90’s and 2014/2015, liquidity conditions were worsening but the strong stock market and strong economy kept the NFCI below 0, signalling liquidity was loose.
In contrast, the ANFCI was above 0 during the same period, signalling conditions were actually tightening.
The ANFCI is a little noisy to look at, but if you smooth the data with a 12-month MA, you get a nice picture of liquidity conditions in the U.S.
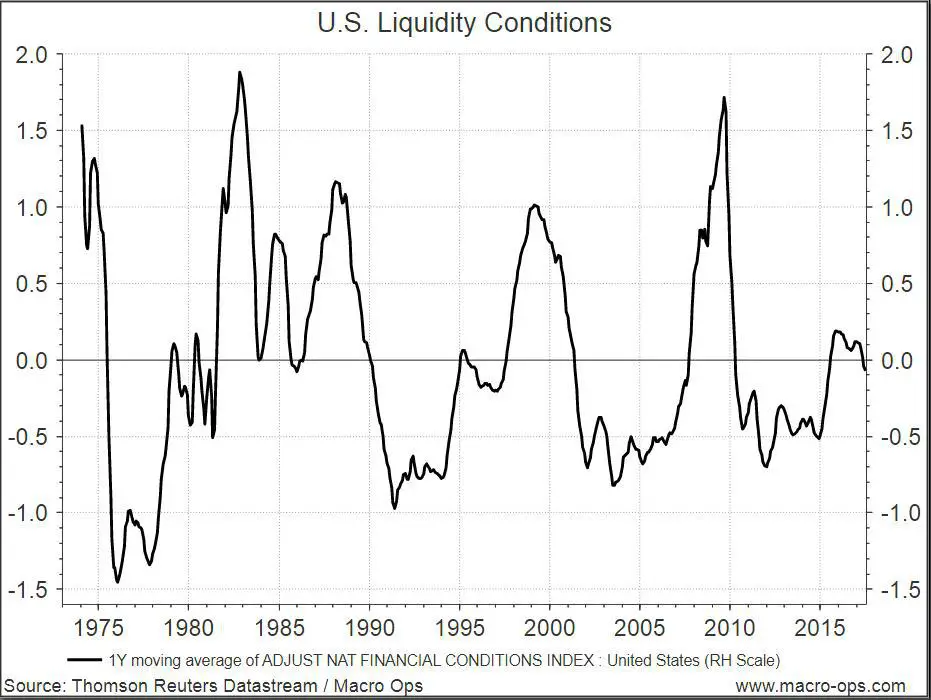
The cyclical nature of our economy becomes clear and it’s easy to see how liquidity predicts business cycles. You can use this tool to help you trade on the right side of the market.
When liquidity is tightening, take bearish trades. When liquidity is loosening, take bullish trades.
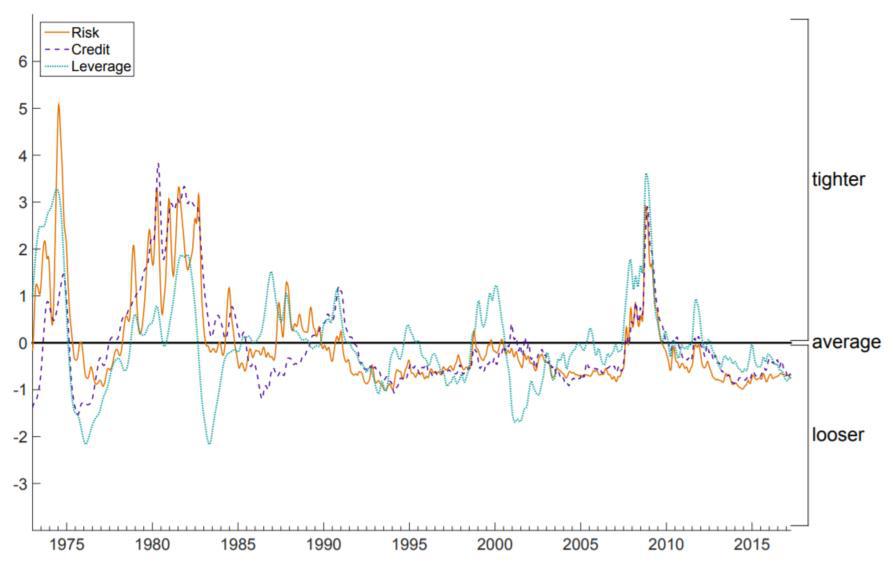
This index is also broken down further into 3 sub indices — risk, credit, and leverage.

Risk is a coincident indicator, credit is a lagging indicator, and leverage is a leading indicator of financial stress.
For trading purposes, the leverage part of the equation matters the most to see where the stock market is headed.
Above average leverage sows the seeds for a recession and a falling stock market. Below average leverage precedes economic booms and stock market rallies.
Ray Dalio discovered this logic long before the Chicago Fed and has made billions trading off it.
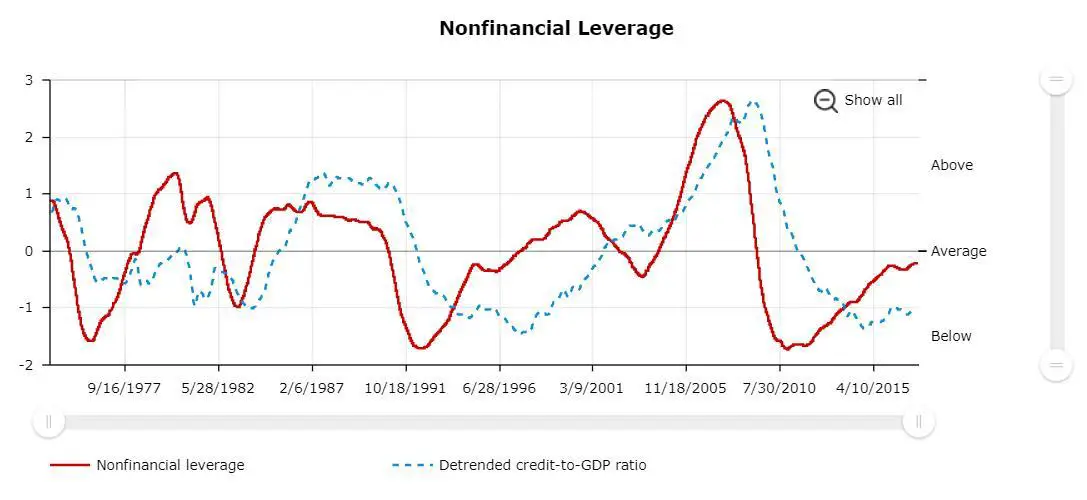
The leverage index can be broken down yet again to only include non financial leverage.
Non financial leverage is one of the most powerful leading indicators of stock market performance.

This graph might look familiar to you because it’s basically the short-term debt cycle, which can help you time markets.
For example, debt was at obscene levels before 2008 and signalled a shorting opportunity. And by 2010 debt was back below average and signalled a buying opportunity.
People are always the most levered at a market top and the least levered at a bottom.
A skilled macro trader wants to do the opposite. Paying attention to non financial leverage will help you do that.
Lever up when others are unlevered and de-lever when others are highly levered.
Despite all the financial doom and gloom we’re drowned with nowadays, non financial leverage readings tell a different story.
Current levels are only average.
Before making your next trade, take a look at these indicators.
How’s liquidity? Where are we at in the debt cycle?
Knowing these answers will make you a lot more confident in your trading. It’s hard to get blind sided by a big crash or miss out on a huge rally when you have a handle on liquidity.
Summary
- Liquidity is a key variable in determining the macro landscape
- We can monitor liquidity using the ANFCI
- If the ANFCI is trending higher, liquidity is tightening and we want to lean bearish
- If the ANFCI is trending lower, liquidity is loosening and we want to lean bullish
- The non financial leverage component of the NFCI tells us where we are in the debt cycle
- We want to buy risk assets at the bottom of the debt cycle (below average leverage) and sell risk assets at the top of the debt cycle (above average leverage)
This is a guest post by Alex @MacroOps which was posted originally here: Liquidity, The NFCI, And Leverage
This post appeared on newtraderu.com and is available here.
If you’re searching for that one trend following strategy that will turn your trading around, then today’s your lucky day. The MACD Trend Following Strategy as the name suggests is one of the best trend following strategies and this strategy is similar to our trend following strategy we have developed a while back. One of the most important features of trend following strategies is that even if you’re wrong on the trade, usually you can limit your losses because ultimately the market will reverse and resume the trend. But, at the same time, which is even more important, it maximizes the potential profit as well. This strategy is included in our complete list of what we believe are the best trading strategies compiled on the internet.
Our team here at Trading Strategy Guides.com only strives to provide you with the best trading strategies.
The MACD Trend Following Strategy works best on the higher time frames like the 4h chart or the daily chart. So if you’re a swing trader this is the perfect strategy for you. We have developed this trend following strategy because we felt the need to show the world how to properly use the MACD indicator and to show how accurate this tool can be in forecasting market turning points.
Continue Reading →
Being a profitable trader is not just about changing what you do but who you are. Unprofitable traders tend to be impulsive, greedy, impatient, and take actions that are random. You don’t need to do one great trade, the odds are that one big trade will cause more damage than good. Like most lottery winners that end up bankrupt most new traders with windfalls from luck give all the money back when the risk of trading too big catches up with them in big losses. The skills a new trader needs to learn is creating good trading signals, proper position sizing, the discipline to follow their plan and the flexibility to go with the price action.
The magic happens after consistently following a quantified trading system day after day and month after month and let profits play out. The sustainable money in trading is learning how to minimise losses, exit winning trades while the money is still there and the compounding of capital over time. The magic happens with the creation of a system that fits your own beliefs and risk tolerance and the repeating of your entries and exits over time.
There are many profitable systems that can make you money, if it was a matter of an idea or a backtest everyone would be rich. It is the execution of the right idea over time with discipline and self control that makes all the difference. The rare trading edge is the trader’s mastery of their own mind and emotions.