Reblog: Is passive investing suitable for India?


Since 2008, the global asset management industry has been reeling under a relentless tsunami. While the assets under management (AUM) of actively managed mutual funds (MFs) have increased from $9.0 trillion to $13.4 trillion, passively managed index funds have surged from $0.6 trillion to $2.2 trillion. These now account for 12% of the total MF industry. Vanguard, the international company most identified with passive investing, had less than $25 billion in AUM for over two decades since its inception in 1975. It crossed the $100-billion mark in 1995. The march of exchange-traded funds (ETFs) has been equally impressive. By various accounts, the total AUM of ETFs has crossed the $2.1-trillion mark. ETFs have made significant inroads into the fixed income asset class, while index funds have been focused on equity.
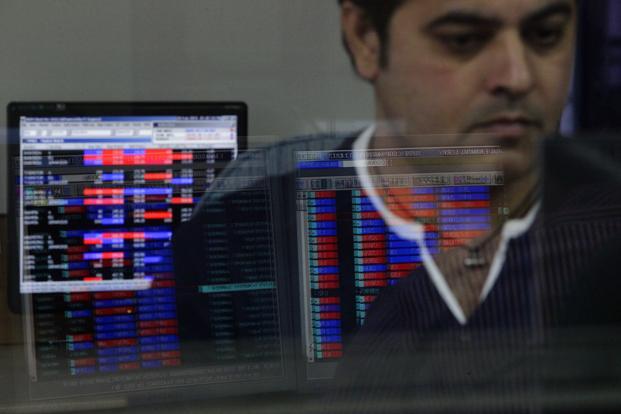
Eager domestic observers are keen to predict the emergence of a similar trend in India. Recently, the Employees’ Provident Fund Organisation (EPFO), which has the potential of becoming the largest equity investor (displacing the Life Insurance Corporation of India) has announced its initial entry into equity investing through the ETF route. Many observers of the Indian MF sector, which is predominantly actively managed, are forecasting the global trend towards passives and ETFs to be the next big development. Is it a case of putting the cart before the horse or is it irreversible?
ETFs may struggle to replicate their success in India
Stage of market development: Vanguard took 20 years to cross $100 billion mark. The advance of passive funds in developed markets required years of education, emergence of institutional investors focused on low costs and the increased equity allocation within pension and endowment funds. In India, equity investing through MFs, as we identify it today, is just over two decades old. The Nifty was created in 1995, trail commission on MFs was introduced in 1993, and banks started selling third-party financial products after 2001. Equity as an asset class for institutional investors like EPFO, got introduced just last year and the decision to invest in equities is already being criticised, as trade unions want the EPFO to invest in guaranteed debt instruments of the government. Even if the allocation is 5% of incremental flows, EPFO is merely following the administrative directives of the Union government without any credible strategy of how to invest in equity; a topic for another day.
Depth of the market
Market structure: Ironically, the two most popular indices identified as the market by laypersons are Nifty and Sensex, indices with 50 and 30 stocks, respectively. Few would be able to identify the broader indices in the Indian market. In the US, for example, S&P 500 is the most popular index, not the narrower Dow 30. Till now, no institutional investor in India has demanded the adoption of a more broad-based index that can better reflect the market. As most observers would say, any narrow and concentrated index would be a less than perfect tool for reflecting the broad market. Nifty covers about 55% of the total Indian market capitalisation (market cap) of $1.63 trillion. In comparison, S&P 500 stocks cover over 80% of the US stock market capitalisation of about $24.44 trillion. In India, the BSE 500 is a truer, broader index, and can be compared to the S&P 500. BSE 500 accounts for 93% of the Indian market capitalisation. However, index futures of BSE 500 or NSE 500 are not traded.
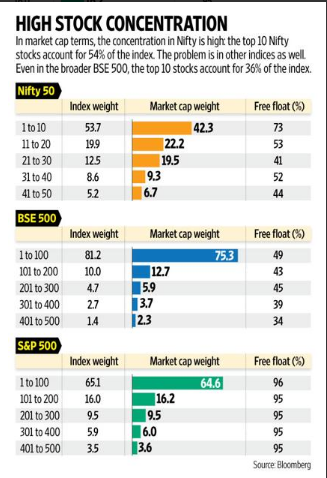
Concentration: Nifty 50, the most followed index in India, is a narrower index when compared to the leading indices in the US where the S&P 500 attracts the largest amount of passive funds. Sample the concentration levels: Nifty’s top 10 stocks account for 54% of the index, whereas for S&P 500, the top 10 stocks account for 20%. This trend is similar across indices in India. In the BSE 500, the top 10 stocks account for 36% of the index. In Nifty, this applies across sectors. On average, the top 3 companies of each sector account for 77% of the sector weight. For S&P 500 this number falls to 32%, whereas even for BSE 500 the concentration of top 3 stocks is 52%. Such an environment is ripe for closet indexing, where the high weightage of the top 10 or the largest companies provides an ideal opportunity to outperform the index over the medium to long term. For example: Nifty’s top weighted company in 2008 had a weight of over 15%. Just one decision here could enable large-cap fund managers to outperform the Nifty for the next 5 years, as the weight of the leader fell to less than 8% over the next four years.
Sector concentration: Over the years, Nifty has witnessed a peculiar problem. The top sector in the index tends to swell over 30% of the index: FMCG in mid-1990s, energy in mid-2000s and currently banking. S&P 500 has experienced such a phenomenon only once: technology had crossed 30% in 2000. The predominance of one sector skews the Nifty sector weights, unlike the S&P 500 where the weights are more equally distributed. The weight of four biggest sectors, excluding the top-weighted sector, is only 43.5%, vs 52.5% for S&P 500. As per Global Industry Classification Standard (GICS) norms, Nifty covers only 22 distinct industries as compared to 61 by S&P 500, and 55 by the BSE 500.
Liquidity: In India all indices are market cap focused. The Nifty 50 has the top 50 companies by market cap (free float adjusted). Nifty Junior has the next 50, Nifty Midcap the next 100 and so on. But these indices do not do not take into account the criterion of liquidity while adding a company to the index. In the US, a company has to pass the test of liquidity to be part of the index: its annual turnover should be 1x of its market cap. In India, only 113 companies out of the BSE 500 would qualify on this criterion.
Free float and the curse of promoter holding: Another anomaly of indices in India is the free float weighted market cap weightage of companies. In layperson terms, the market cap of a company is multiplied by the free float (i.e., shareholding, excluding identifiable promoter holdings, which can be freely traded). The free float in S&P 500 companies is in excess of 95%, while in Nifty it is about 55%. Thus, the market cap of a company determines its weight in the index in the US, while the free float influences its weight in India. The free float also varies drastically across sectors: it is 72% for financials and 30% for energy companies. This has several distorting effects: the financial sector currently has a weight of 31% in Nifty, while it accounts for 20% of the profits and 21.7% of the market cap on an absolute basis. Within the sector, companies like HDFC Bank Ltd and ICICI Bank Ltd have a higher weights relative to their absolute profit, due to the favourable free float factor.
Given the above factors, for passive investing to become a credible option in India for long-term equity investors, the following factors need to play out. Passive investing requires a broader index like the S&P 500, not concentrated indices like the Nifty or Sensex. While 500 and 100 stock indices are available in India, their popularity with investors is negligible.
As compared to the S&P 500, even the BSE 500 scores poorly on free float, liquidity in terms of turnover and the depth of coverage by analysts; which result in significant alpha-generating opportunities for the active investors.
Passive investing is all about spreading your bets not taking concentrated bets. Second, sector spread and depth need to be far greater. The excessive weight of a single sector—currently banking—makes the index more skewed rather than a true diversified index. The low free float and the ensuing liquidity of stocks beyond the top 90-110 stocks limits the ability of investors to hedge individual stocks through stock futures or options. For any stock to be part of the index, its liquidity parameter has to be relevant, artificial support by including it in futures or options segment does not improve liquidity. Finally, index futures are currently are limited to Nifty 50, Bank Nifty and Nifty Junior to a lesser extent. These should be expanded to include more broad-based 100- and 200-stock indices to give passive investors a better breadth of the market under coverage.
The shortcomings of passive investing in an emerging market like India are an important lesson, which investors can ignore only at their own peril. While globally the trend towards passive investing has gathered momentum, India lacks broad-based indices, which are a key essential for passive investing to take off. Rather than taking this trend for granted, the concerned stakeholders—institutional investors, exchanges and market participants—would need to make concerted efforts in this direction. The lure of passive investing, carries with it substantial peril. Caveat emptor.
Anoop Bhaskar, head-equities, and Viraj Kulkarni, research analyst, IDFC Asset Management Co. Ltd.
The article is authored by Anoop Bhaskar & Viraj Kulkarni and appeared in The Mint. The link to the article is here.