Reblog: Analyzing Trading Volume: The Ultimate Guide
Volume is representative of how many shares change hands in a stock, and as such, it indicates the interest in a security. Since each stock is different, and has a different amount of shares outstanding, volume can be compared to historical volume within a stock to spot changes, or compared to other stocks to find which are suitable for trading. Volume is also used to confirm price trends, breakouts, and spot potential reversals. Volume has also been implemented into indicators, which can aid in analyzing stocks (and other markets).
Volume Significance
Volume is important because it shows the level of interest in a stock. Current volume in a stock, relative to prior volume, shows if interest is higher or lower in a stock than it was before. High volume, or relatively high volume (compared to prior volume), is more suitable for active traders. Very low volume typically indicates a lack of interest and usually little price movement. Volume is also significant for screening stocks. Average volume—the typical volume seen in a day over a period time—helps greatly in this regard. Day traders need to be able to get in and out of a stock quickly and with ease, so they will want to trade stocks with high daily volume – typically 1 million shares at absolute minimum.Swing traders and investors have a little more leeway and therefore may trade stocks with lower volume, around 500,000 and 100,000 shares or more per day, respectively. They still want stocks that have enough volume to get in and out when they need to, but the urgency is not quite as high as it is for short-term traders.That’s the significance of volume as a defined number; here’s how to analyze it.
Analyzing Volume
There are three primary ways we can use volume in conjunction with price analysis: confirming trends (or not), spotting potential price reversals, and confirming price breakouts (or not).
Confirm Price Trends
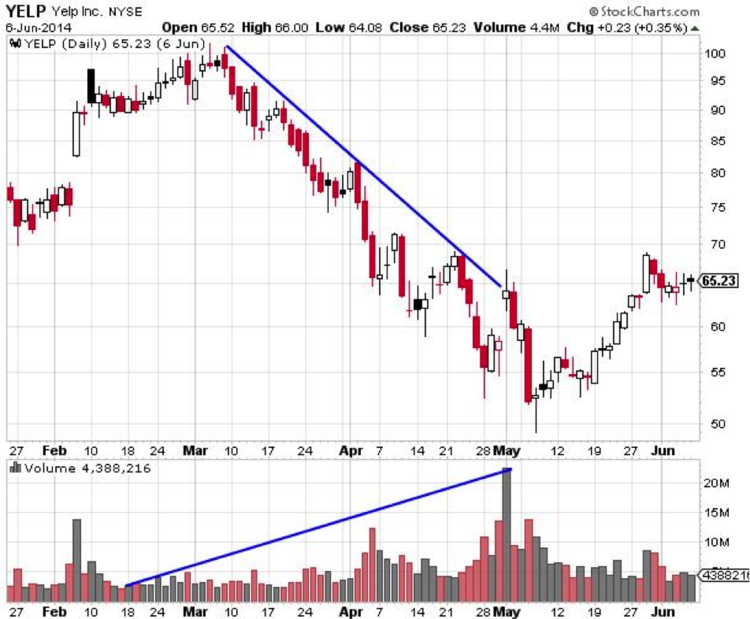
Volume is a secondary indicator to price; it provides more information about the price trend but doesn’t provide trade signals on its own. This is important to remember when considering these general volume guidelines for price trends: increasing volume in the direction of the trend helps confirm that trend direction.Figure 1 shows this in action. Volume gradually increases as the price declines. If you are short, the rising volume helps confirm the downtrend and thus your position. If you are long, the rising volume on the price decline tells you the price could continue to drop and it may be time to look for an exit.
Figure 1. Volume Increases in Direction of Trend, YELP Daily
Declining volume during an uptrend indicates that interest is decreasing. Price can still continue to rise on declining volume though. Declining volume foreshadows an eventual reversal, but shouldn’t be acted upon until the price actually breaks the uptrend.
Declining volume during a downtrend doesn’t tell us a lot, because a lack of interest can either indicate a lack of buying interest, which continues to the push the price lower, or a lack of selling interest, which could eventually push the price higher.
These guidelines are usable up to a point. Increasing volume helps confirm the trend, but when the volume spikes, often associated with a big price move, it usually indicates a price reversal is close at hand.
Price Reversals
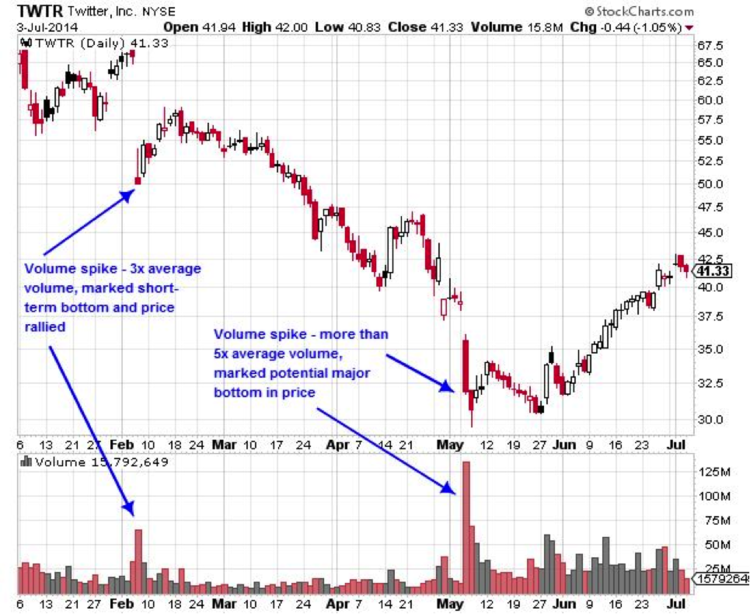
When volume spikes to an extreme, relative to typical volume, it indicates that buyers or sellers may be exhausted.When the volume spike occurs after a run higher in price, it indicates buyers could soon be exhausted, and with no buyers left to push the price up, the price will drop.When the volume spike occurs after a run lower in price, it indicates sellers could soon be exhausted, and with no sellers left to push the price down, the price will rise.Figure 2 shows this in action. There are two price spikes, noticeable because they stick out compared to the other, more normal, volume bars around them. The first spike occurs in February. A big gap down in price on very high volume indicated potential exhaustion on the part of sellers. The price rebounded for a short period of time.Another very significant volume spike occurs in May, where volume was more than five times what we normally see. This sort of capitulation selling indicated that a potential major turning point for the stock was close at hand, since most of the traders who wanted to sell did so on that very high volume day.
Figure 2. Very High Volume Indicates a Reversal May be Near – TWTR Daily
Volume only provides insight, not trade signals. Price ultimately needs to confirm what volume is saying. In Figure 2, the price needed to start to rise following the volume spikes to confirm the short-term bottom in price.Following a volume spike, look to see how volume responds on the next price wave to provide more evidence of a price reversal.When there is a major volume spike following a down move and then the price pops, watch volume on the next price decline. If the volume on the price decline is lower than it was on the volume spike there is a good chance the price will continue higher.
Figure 3. Volume Comparison to Confirm Reversal – TWTR Daily
When there is a major volume spike following an up move and then the price drops, watch volume on the next price rally. If volume on the rally is lower than it was on the volume spike there is a good chance the price will continue lower.
Price Breakouts
When there are strong support and resistance levels, volume can help confirm a breakout. If the price has struggled to get above a certain price it is going to take conviction on the part of the buyers to push it through that level. Conviction is shown via volume.
A break above resistance, or below support, on larger than average volume shows conviction and the breakout is more likely to be legitimate.
A break above resistance, or below support, on low volume shows little conviction; the breakout is more likely to fail.
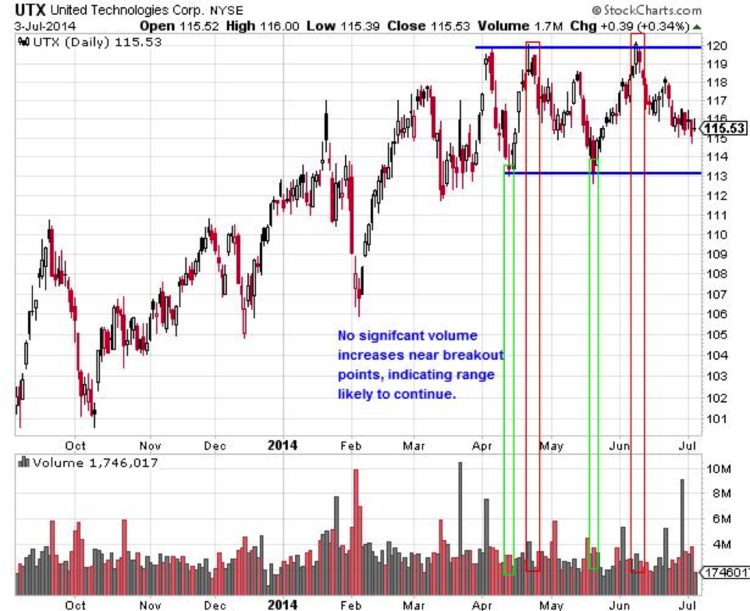
A common problem is buying an upside breakout, or selling a downside breakout, when volume doesn’t confirm it.Figure 4 shows a small price range; had you bought near the top of this range, or sold near the bottom, it would have resulted in a losing trade. Volume didn’t increase as it approached resistance or support, which told us any breakout that occurred was more likely to fail.
Figure 4. Volume not Confirming Breakouts – UTX Daily Chart
If volume had increased as the price broke above resistance, or below support, we should be more inclined to trade in the direction of the breakout.
Using Volume Indicators
Volume and price are the purest indicators, yet because of this there can also be a lot of “noise.” Indicators help smooth out the data, make it more visually appealing, and may help you spot important changes in volume or price not easily seen on a basic chart.There are a large number of volume based indicators, although many of them function in similar ways. Here are three popular volume indicators, and how to interpret them.
On Balance Volume (OBV)
On Balance Volume takes a running total of volume, adding the volume of a price bar when it closes higher than the prior, and subtracting the volume of price bars that close lower than the prior. It is a quick way to see if volume is increasing in the trending direction.When the price is rising, OBV should also be rising. If the price is rising but OBV is falling it shows that uptrend may be in trouble. This is because down days are seeing more volume than up days, thus pushing the indicator lower.
This indicator includes both price and volume in its calculation. When prices are moving higher the indicator moves higher, but by how much is determined by volume. Large volume results in greater indicator increases, while low volume advances result in smaller indicator increases.When price is moving lower, the indicator moves lower, but by how much is determined by volume.Similar to OBV this indicator helps confirm the trend, or indicate that trouble may be afoot. CMF doesn’t necessarily need to move in the same direction as price; as long as the indicator is above zero it helps confirm the uptrend. For a downtrend to be confirmed, the indicator should be below zero.When the indicator oscillates near zero it indicates there is little conviction on the part of buyers or sellers, and likely no price trend.To learn more, check out our Ultimate Guide to Chaikin Money Flow.
VWAP and Moving VWAP
Volume Weighted Average Price (VWAP) is the average price, weighted by volume, over the course of trading day. It gives traders an idea of the “typical” price seen during the trading day. Each day VWAPstarts over, only showing the volume weighted average price for that day.Moving VWAP is an x-period average of the VWAP; therefore, it creates a continuous average from day to day. The Moving VWAP is similar to a simple moving average, except it also accounts for volume, and can be used in a similar fashion.
The Bottom Line
Volume is a significant tool because it shows the conviction of buyers and sellers. Increasing volume, as a general rule, helps confirm the current trend. When volume reaches extreme levels, multiple times average volume, it indicates a trend may be ending. Volume is also useful for confirming breakouts; volume should rise when the breakout occurs. Indicators such as OBV and CMF can also be used. The indicators include volume in their calculation, and can therefore be used to monitor the strength of a trend. VWAP and Moving VWAP show the typical price of a security, and Moving VWAP can be used in similar ways to a traditional moving average.
The original article is authored by Cory Mitchell, appears on traderhq.com and is available here.