A 25 basis point (bps)-rate cut by the Reserve Bank of India (RBI) on Friday failed to cheer market participants as concerns over slowing economic growth dented investor sentiment. In its fourth bi-monthly monetary policy meet, the RBI’s monetary policy committee (MPC) did cut the repo rate, as widely expected; however, a sharp reduction in the GDP growth forecast to 6.1 per cent for the financial year 2019-20 (FY20) caught investors off guard.
Benchmark indices, S&P BSE Sensex and NSE’s Nifty50, lost over 1 per cent, thus taking their losing streak to the fifth consecutive session.
The S&P BSE Sensex dropped 434 points or 1.14 per cent to settle at 37,673.31. Financial stocks led the decline with HDFC Bank, ICICI Bank, and Axis Bank falling up to over 3 per cent.
On the NSE, the frontline index Nifty50 ended at 11,175, down 139 points or 1.23 per cent.
On a weekly basis, Sensex shed nearly 3 per cent while Nifty50 lost 2.93 per cent.
On the sectoral front, Nifty Bank index slid nearly 700 points or 2.40 per cent to settle at 27,731.85 levels, with 10 out of 12 constituents ending in the red. Nifty IT index was the only sectoral index on the NSE that ended in the green. The Nifty IT index ended at 15,340.30, up 62 points or 0.41 per cent.
In the broader market, the S&P BSE MidCap index lost 131 points or 0.94 per cent to settle at 13,713.79 levels, while the S&P BSE SmallCap index closed at 12,809, down 102 points or 0.79 per cent.
Continue Reading →
The following is an excerpt from Barton Bigg’s book, Hedgehogging, where he relates a conversation with “Tim”, a successful macro investor (emphasis mine).
Tim works out of a quiet, spacious office filled with antique furniture, exquisite oriental rugs, and porcelain in a leafy suburb of London with only a secretary. My guess is he runs more than $1 billion, probably half of which is his. On his beautiful Chippendale desk sits a small plaque, which says totis porcis—the whole hog. There is also a small porcelain pig, which reads, “It takes Courage to be a Pig.” I think Stan Druckenmiller, who coined the phrase, gave him the pig.
To get really big long-term returns, you have to be a pig and ride your winners… When he lacks conviction, he reduces his leverage and takes off his bets. He describes this as “staying close to shore… When I asked him how he got his investment ideas, at first he was at a loss. Then, after thinking about it, he said that the trick was to accumulate over time a knowledge base. Then, out of the blue, some event or new piece of information triggers a thought process, and suddenly you have discovered an investment opportunity. You can’t force it. You have to be patient and wait for the light to go on. If it doesn’t go on, “Stay close to shore.”
What separates the great traders from those who are just good?
The answer is knowing when to size up and eat the whole hog.
Let me explain.
Continue Reading →
Selling in select blue-chip counters such as HDFC, IndusInd Bank, TCS, L&T, ONGC, and Vedanta and weak global cues dragged the equity market lower on Friday. The S&P BSE Sensex lost 167 points or 0.43 per cent to settle at 38,822.57 while the Nifty50 index of the National Stock Exchange (NSE) closed the day at 11,512.40, down 59 points or 0.51 per cent.
On a weekly basis, however, Sensex gained 2.12 per cent while Nifty added 2.11 per cent.
In the broader market, the S&P BSE Mid-cap index ended at 14,266, down 90 points or 0.62 per cent and the S&P BSE Small-cap index lost 109 points or 0.81 per cent to settle at 13,332 levels.
On the sectoral front, metal stocks slipped the most with the Nifty Metal index ending 2.64 per cent lower at 2,453.95 levels. Realty and pharma counters were the other leading losers of the day.
Continue Reading →
Whether you are a price action, a pattern, an indicator or whatever trader, if you are able to identify strong price levels on your charts, it can greatly improve the quality of your trading.
Instead of taking signals and trades all over the place, the better trades usually happen at key price levels. Those strong areas of interest show that buyers and sellers are concentrating at those levels and they can be the starting or turning points for new price moves and mark new trends as well.
If you are a breakout trader, you need to find areas that can lead to strong breakouts, if you are a trend-following trader you must identify pullback areas or trend continuation points, a reversal trader looks for key turning points and a range trader should focus on well-developed ranges with clearly defined price levels.
Continue Reading →
If you want to trade macro, you need to understand liquidity.
PTJ, Druck, Soros, Dalio — all these legends have expressed this fact multiple times.
Liquidity is what moves markets.
This is even more true now than in the macro heydays of the 70s and 80s.
With the rise of “blind investing” in the form of passively buying and holding ETFs, the majority of investors don’t care about valuation or merit. They just auto-shuttle their excess funds to the nearest robo advisor without a second thought.
This amount of “excess funds” is largely dependent on liquidity conditions.
When liquidity is loose, it’s cheap to get levered. People have extra cash and plow it into risk assets. Prices rise.
When liquidity is tight, people have less cash to spend. They may even sell stuff to service their existing debt. Prices fall.
There are a myriad of ways to measure and monitor liquidity conditions.
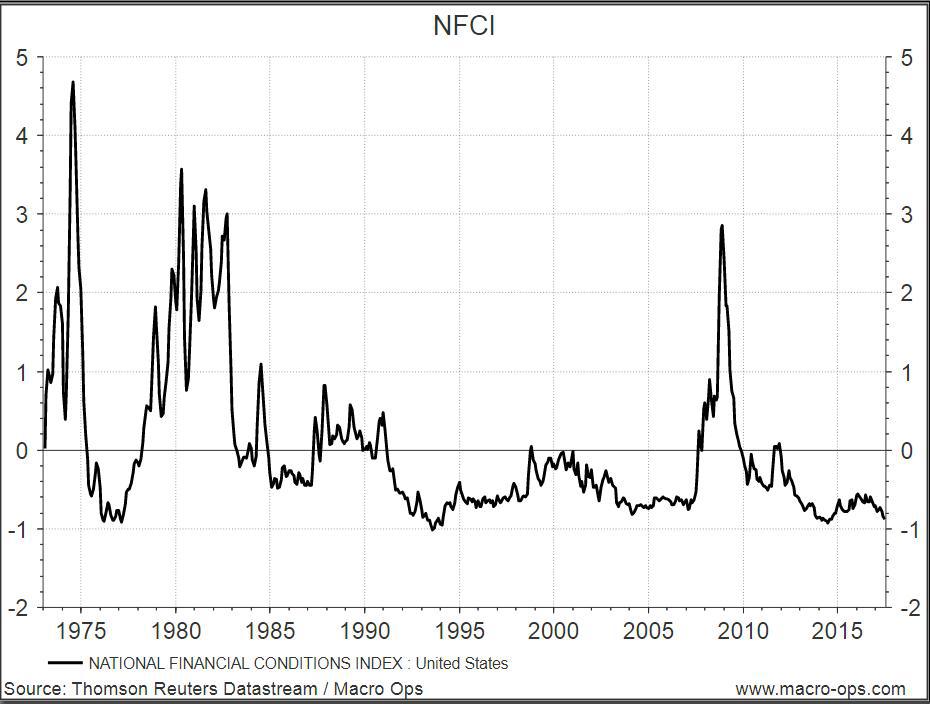
No single method is best, but one of our favourites is using the Chicago Fed’s National Financial Conditions Index (NFCI).
This index combines over 105 different indicators of financial activity to form one easy-to-read liquidity measurement. Money markets, debt markets, equity markets, traditional banking systems, “shadow” banking systems — they’re all included.
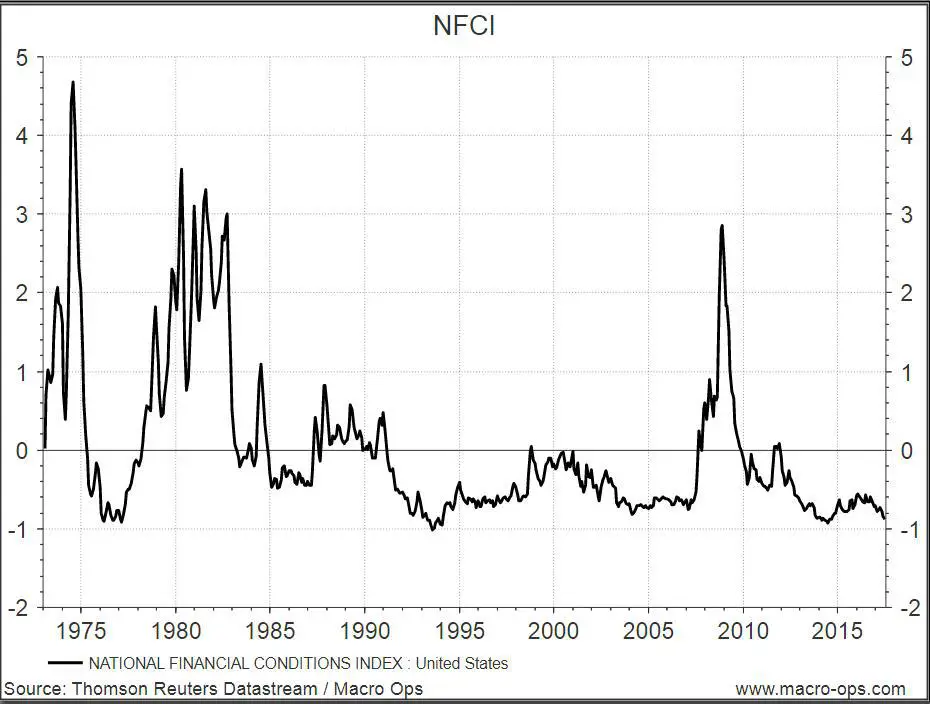
The zero line represents average liquidity conditions. Positive values indicate tighter-than-average conditions and negative values indicate looser-than-average conditions.
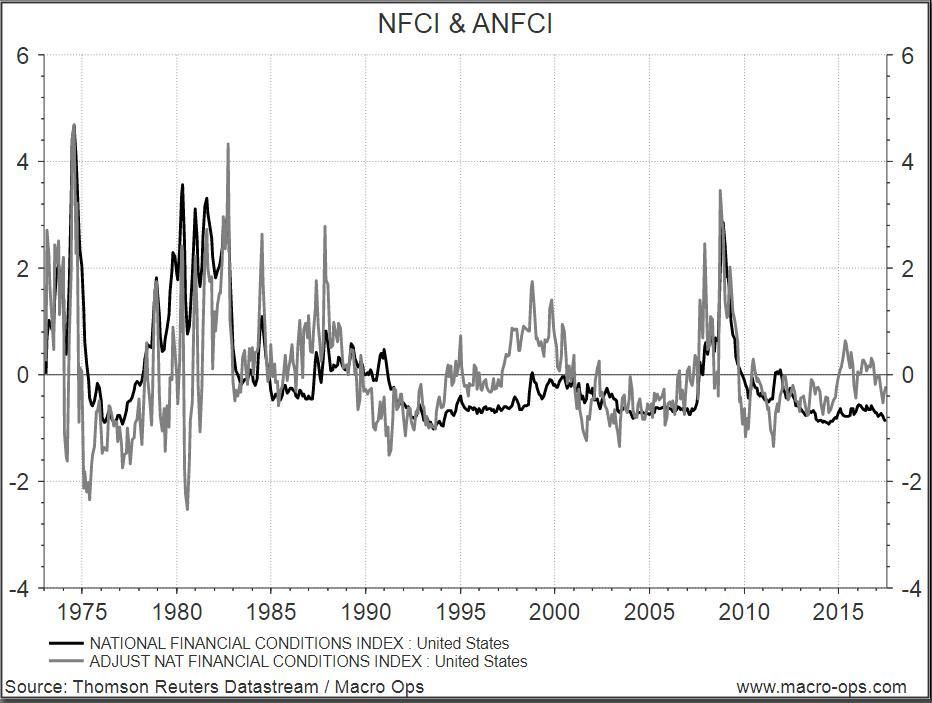
The Chicago Fed also publishes the Adjusted National Financial Conditions Index (ANFCI).
Since financial liquidity conditions are highly correlated to economic conditions, this index isolates the uncorrelated component. It tells us what liquidity conditions are like relative to economic conditions.
Positive values indicate liquidity conditions are tighter than would be suggested by current economic conditions, while negative values indicate the opposite.
You can see the difference between the standard and adjusted index in the graph below.
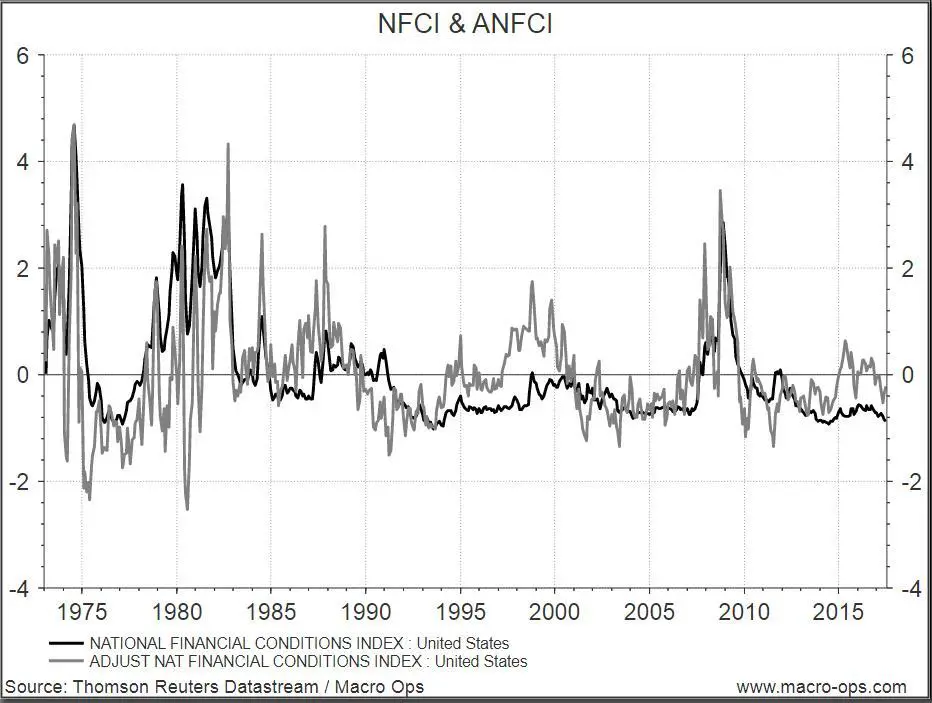
We prefer the ANFCI because it isolates liquidity conditions better than the NFCI.
The NFCI doesn’t always tell you when liquidity is deteriorating. In the late 90’s and 2014/2015, liquidity conditions were worsening but the strong stock market and strong economy kept the NFCI below 0, signalling liquidity was loose.
In contrast, the ANFCI was above 0 during the same period, signalling conditions were actually tightening.
The ANFCI is a little noisy to look at, but if you smooth the data with a 12-month MA, you get a nice picture of liquidity conditions in the U.S.
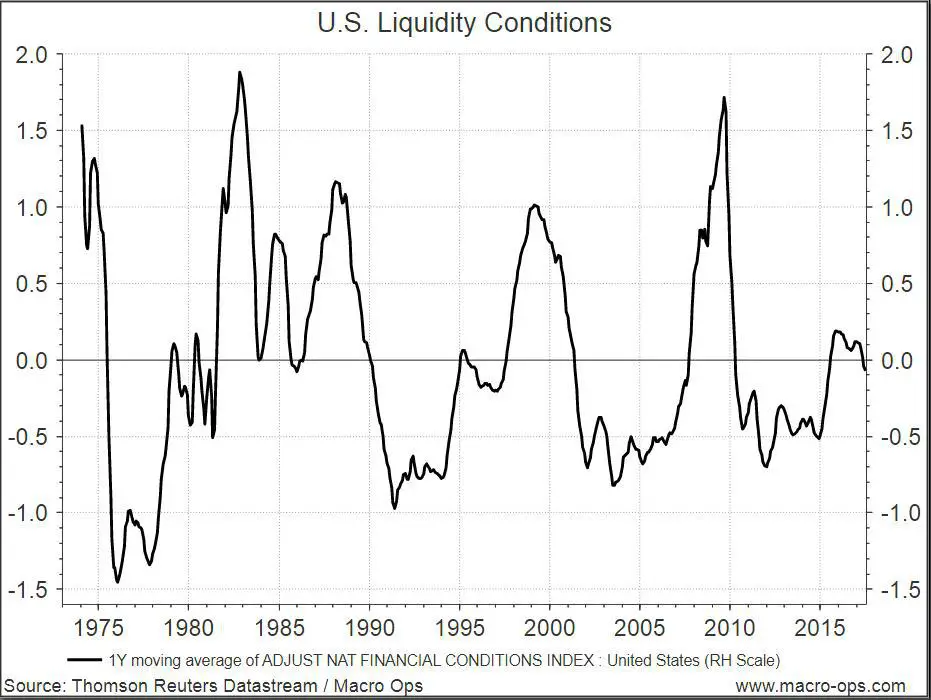
The cyclical nature of our economy becomes clear and it’s easy to see how liquidity predicts business cycles. You can use this tool to help you trade on the right side of the market.
When liquidity is tightening, take bearish trades. When liquidity is loosening, take bullish trades.
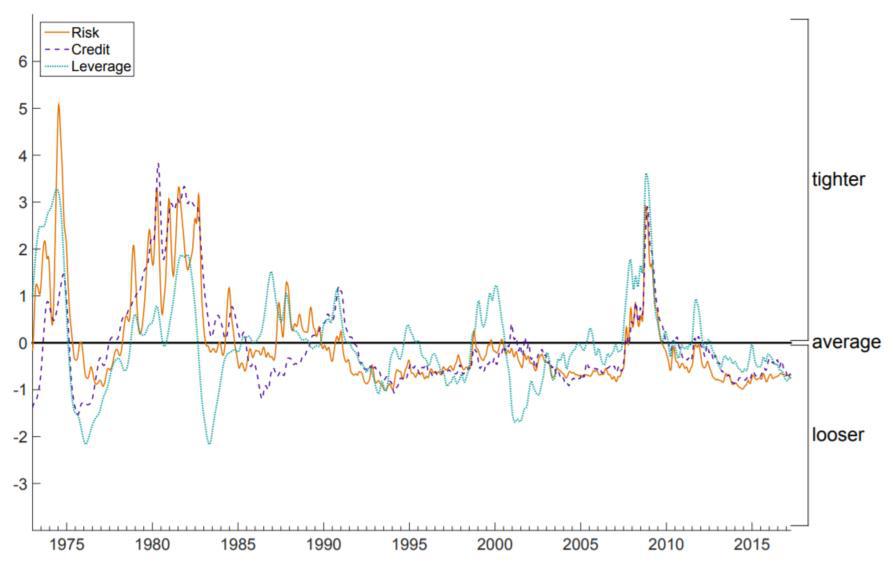
This index is also broken down further into 3 sub indices — risk, credit, and leverage.

Risk is a coincident indicator, credit is a lagging indicator, and leverage is a leading indicator of financial stress.
For trading purposes, the leverage part of the equation matters the most to see where the stock market is headed.
Above average leverage sows the seeds for a recession and a falling stock market. Below average leverage precedes economic booms and stock market rallies.
Ray Dalio discovered this logic long before the Chicago Fed and has made billions trading off it.
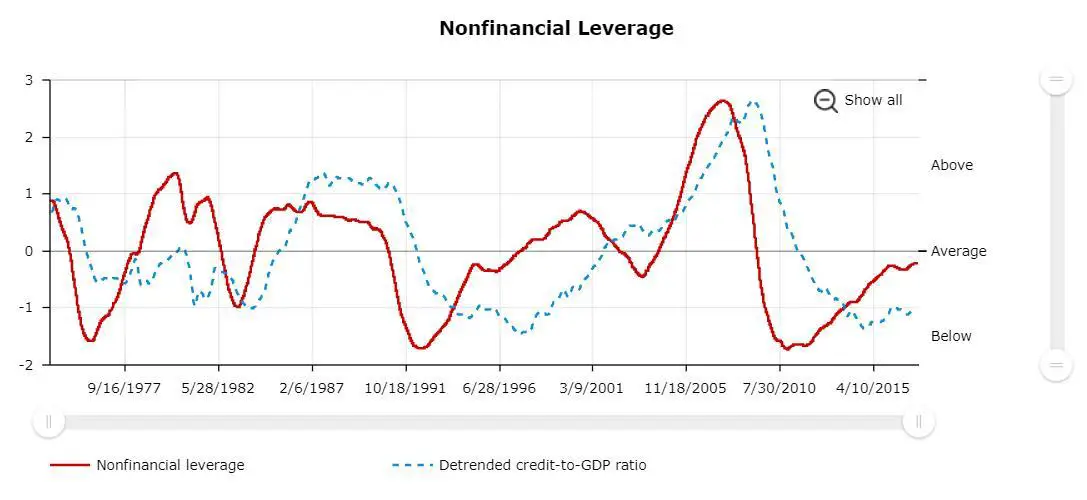
The leverage index can be broken down yet again to only include non financial leverage.
Non financial leverage is one of the most powerful leading indicators of stock market performance.

This graph might look familiar to you because it’s basically the short-term debt cycle, which can help you time markets.
For example, debt was at obscene levels before 2008 and signalled a shorting opportunity. And by 2010 debt was back below average and signalled a buying opportunity.
People are always the most levered at a market top and the least levered at a bottom.
A skilled macro trader wants to do the opposite. Paying attention to non financial leverage will help you do that.
Lever up when others are unlevered and de-lever when others are highly levered.
Despite all the financial doom and gloom we’re drowned with nowadays, non financial leverage readings tell a different story.
Current levels are only average.
Before making your next trade, take a look at these indicators.
How’s liquidity? Where are we at in the debt cycle?
Knowing these answers will make you a lot more confident in your trading. It’s hard to get blind sided by a big crash or miss out on a huge rally when you have a handle on liquidity.
Summary
- Liquidity is a key variable in determining the macro landscape
- We can monitor liquidity using the ANFCI
- If the ANFCI is trending higher, liquidity is tightening and we want to lean bearish
- If the ANFCI is trending lower, liquidity is loosening and we want to lean bullish
- The non financial leverage component of the NFCI tells us where we are in the debt cycle
- We want to buy risk assets at the bottom of the debt cycle (below average leverage) and sell risk assets at the top of the debt cycle (above average leverage)
This is a guest post by Alex @MacroOps which was posted originally here: Liquidity, The NFCI, And Leverage
This post appeared on newtraderu.com and is available here.
It was a historic day for the equity markets on Friday as the frontline indices rallied over 5 per cent after Finance Minister Nirmala Sitharaman announced reduction in corporation tax. The FM announced that the effective corporate tax rate will be lowered to 25.75 per cent.
Benchmark indices – S&P BSE Sensex and Nifty50 — posted their biggest single-day gain in 10 years while the Nifty Bank and Nifty MidCap index posted the biggest-ever single-day gain. The market capitalisation of BSE-listed stocks saw an increase of nearly Rs 7 lakh crore.
The benchmark S&P BSE Sensex added 1,921 points or 5.32 per cent to settle at 38,014.62, with Hero MotoCorp (up 13 per cent) being the top gainer and Power Grid Corporation (down over 2 per cent) the biggest loser.
On NSE, the Nifty50 index ended at 11,274 levels, up 569 points or 5.32 per cent, with 44 out of 50 constituents advancing and 6 ending in the red.
Volatility index India VIX dropped over 1 per cent to settle at 15.34 levels.
In the broader market, the S&P BSE MidCap index gained 835 points or over 6 per cent to end at 14,120 and the S&P BSE SmallCap Index settled at 13,204.25, up 501 points or nearly 4 per cent.
On the sectoral front, barring IT stocks, all the sectoral indices on the NSE ended in the green. The Nifty IT index settled 0.20 per cent lower at 15,491.05 levels.
Continue Reading →

If you’re searching for that one trend following strategy that will turn your trading around, then today’s your lucky day. The MACD Trend Following Strategy as the name suggests is one of the best trend following strategies and this strategy is similar to our trend following strategy we have developed a while back. One of the most important features of trend following strategies is that even if you’re wrong on the trade, usually you can limit your losses because ultimately the market will reverse and resume the trend. But, at the same time, which is even more important, it maximizes the potential profit as well. This strategy is included in our complete list of what we believe are the best trading strategies compiled on the internet.
Our team here at Trading Strategy Guides.com only strives to provide you with the best trading strategies.
The MACD Trend Following Strategy works best on the higher time frames like the 4h chart or the daily chart. So if you’re a swing trader this is the perfect strategy for you. We have developed this trend following strategy because we felt the need to show the world how to properly use the MACD indicator and to show how accurate this tool can be in forecasting market turning points.
Continue Reading →
Being a profitable trader is not just about changing what you do but who you are. Unprofitable traders tend to be impulsive, greedy, impatient, and take actions that are random. You don’t need to do one great trade, the odds are that one big trade will cause more damage than good. Like most lottery winners that end up bankrupt most new traders with windfalls from luck give all the money back when the risk of trading too big catches up with them in big losses. The skills a new trader needs to learn is creating good trading signals, proper position sizing, the discipline to follow their plan and the flexibility to go with the price action.
The magic happens after consistently following a quantified trading system day after day and month after month and let profits play out. The sustainable money in trading is learning how to minimise losses, exit winning trades while the money is still there and the compounding of capital over time. The magic happens with the creation of a system that fits your own beliefs and risk tolerance and the repeating of your entries and exits over time.
There are many profitable systems that can make you money, if it was a matter of an idea or a backtest everyone would be rich. It is the execution of the right idea over time with discipline and self control that makes all the difference. The rare trading edge is the trader’s mastery of their own mind and emotions.
Benchmark indices surged in the last hour of Friday’s trading session after trading in a range-bound manner for a major part of the day.
The S&P BSE Sensex added 239 points or 0.8 per cent to 37,380 levels. Hero MotoCorp, ICICI Bank, Kotak Mahindra Bank, Maruti Suzuki India, and HCL Tech were the top gainers in the Sensex pack. The broader Nifty50 hovered around 11,080 levels, up 100 points, or 0.9 per cent.
The Nifty sectoral indices, except three, were trading in the green. While Nifty Realty index rose the highest 1.6 per cent, Nifty Auto index also gained 0.9 per cent. On the other hand, Nifty Pharma index was the top loser, down 0.9 per cent.
In the broader market, the S&P BSE MidCap index was trading flat at 13,610 levels. Meanwhile, the S&P BSE SmallCap index surged 64 points, or 0.5 per cent, to 12,970 levels.
Shares of banks and non-banking financial companies (NBFCs) dropped up to 5 per cent in the morning deals on Friday, a day after Altico Capital India, a lender to real estate companies, said it has defaulted on interest payments to Mashreq Bank of Dubai. An interest payment of Rs 19.97 crore was due on September 12, according to a regulatory filing with the BSE. This payment is now in default. The principal amount for the external commercial borrowing on which Altico Capital has defaulted stands at Rs 340 crore, the filing said.
Continue Reading →
Market Wizard Linda Raschke’s Technical Trading Rules
- Buy the first pullback after a new high. Sell the first rally after a new low.
- Afternoon strength or weakness should have follow through the next day.
- The best trading reversals occur in the morning, not the afternoon.
- The larger the market gaps, the greater the odds of continuation and a trend.
- The way the market trades around the previous day’s high or low is a good indicator of the market’s technical strength or weakness.
Continue Reading →