
At the risk of sounding philosophical, cultivate a healthy sense of detachment from your portfolio and markets. Photo: Bloomberg
An inescapable facet of being a relative return fund manager is that your performance is always measured against a benchmark index. A layperson may not take it kindly if they are asked, “How’s your performance?” But we fund managers are quite used to the question and the words underperformance and outperformance, though not very common in everyday usage, are quite common in the money management lexicon.
Equally inescapable is the fact that every fund manager, however good, will go through phases of underperformance, i.e. their fund’s returns will be lesser than the benchmark index. The only known exception to this was possibly Bernie Madoff but we all know how that ended. Not even Warren Buffett has escaped this truth. In fact, he puts a simple table with Berkshire Hathaway’s per share book value growth and S&P index returns on the first page of every annual letter that he writes to shareholders. The 2017 letter shows that in six out of the past 10 years, Berkshire’s book value growth underperformed the S&P 500 and yet nobody would debate the fact that the cumulative return, both absolute and relative, over many decades has been astounding. However an average investment committee whose patience generally wears thin after a couple of consecutive years of underperformance would have sacked Buffett as a fund manager thrice in his career. Not having an investment committee breathing down his neck is perhaps Buffett’s biggest competitive advantage.
Lesser mortals though have to play this relative performance game and the unfortunate part is that index returns can be computed for all time periods from minutes to decades. I vividly recall a conversation with a fellow fund manager who was lamenting that he was already down 25 basis points against the index and it was only 10.30 in the morning.
Availability bias means that what’s measurable will be measured, irrespective of whether it is signal or noise. There are a few tell-tale symptoms of a fund manager who is underperforming even if it’s for a short period of time, like a few months. The first symptom is obsession with daily relative performance. Waking up bleary eyed to check this first thing in the morning is the most common sign. An extension of this is an unhealthy obsession with the performance of one’s peer group funds. Once done checking your own fund’s net asset value (NAV), you go through the NAV of your peer group funds to see if they are doing better or worse. This also morphs into obsession with peer group portfolios and who is buying or selling what.
Another symptom is to dissect index returns and focus too much on stocks that are in the index and have done well over the last few months. While being sure of why you don’t own a certain stock is important, spending too much time analysing stocks and sectors just because they have done well in the recent past will lead to biases. Shying away from investor communication is another sign. This is true not only for underperforming fund managers but also for companies which are going through a soft patch in their business cycle. All of us know of companies that are on multiple business news channels and investor roadshows when the going is good, but go into a shell when things turn for the worse. Loss of productivity due to fleeting attention span, given the pre-occupation with price movements and a constant state of irritability, that in an advanced stage leads to viewing everything negative through lens of a conspiracy theory are some of the other pitfalls.
The symptoms might seem formidable and yet you are not the first fund manager to exhibit them. Through self-observation and learning from seasoned investors who have seen these cycles multiple times, there are a few hacks to better contend with the symptoms. The one that helps most is knowing your investment style. Every fund manager should be able to clearly articulate in what kind of a market environment their style would work and when it wouldn’t. This should be mandatory material in every marketing pitch and should be emphasized, especially in the good times.
In times when the portfolio is underperforming the index, having this clarity can give tremendous confidence. Buffett alluded to this quite early in his investing journey. In his second annual letter to limited partners written in 1957, he said: “Our performance, relatively, is likely to be better in a bear market than in a bull market… In a year when the general market had a substantial advance, I would be well satisfied to match the advance of the averages.”
Rather than staring at the screen, a better use of time is to revisit the rationales you had written while buying the stocks in your portfolio and see if they are still valid. Engage with management teams again to ensure that your conviction still holds and weed out names where the original thesis is not playing out. Also, this should be a time when you pro-actively communicate with your investors and re-emphasize your style. It is important to know that your investors derive comfort from your confidence and getting into a shell in such times is detrimental.
Lastly, at the risk of sounding philosophical, cultivate a healthy sense of detachment from your portfolio and markets. This does not mean you abdicate responsibility but it means that you should be able to prevent the symptoms from taking over all your waking moments. All this is obviously easier said than done and this is much more a note to self rather than a sermon for anybody else. But if this helps a fellow investor cope with the symptoms even slightly better, it would have more than served its purpose.
Swanand Kelkar is managing director at Morgan Stanley Investment Management. These are his personal views. The article appeared on livemint.com and is available here.
Markets ended flat on Friday dragged by uncertainty over announcement of any revival package by the government and weak global cues. Indices remained lacklustre for better part of the day, only to turn volatile in the afternoon trading session.
The benchmark S&P BSE Sensex settled with gains of 39 points, or 0.10 per cent, at 37,350 levels led by banking and automobile stocks. The gains were, however, capped by losses in the technology and metal scrips. Power Grid, Maruti Suzuki, YES Bank, and IndusInd Bank were the top gainers at the 30-share index, while TCS, Vedanta, HCL Tech, and HDFC were the top laggards. The broader Nifty50, too, closed at 11,048-mark, up 18 points or 0.17 per cent.
Sectorally, public sector banks gained the most, with the Nifty PSU Bank index closing 1.5 per cent higher. This was followed by Nifty auto index, up 1.15 per cent. Nifty IT and pharma indices ended with cuts of 0.65 per cent and 0.77 per cent, respectively.
In the intra-day trade, the Sensex and Nifty50 slumped to lows of 36,974 and 10,924 levels, down 337 points and 105 points respectively.
In the broader market, S&P BSE mid-cap ended the day at 13,491 level, up 14 points or 0.10 per cent. Further, S&P BSE small-cap settled at 12,585 level, up 14 points, or 0.11 per cent.
Continue Reading →
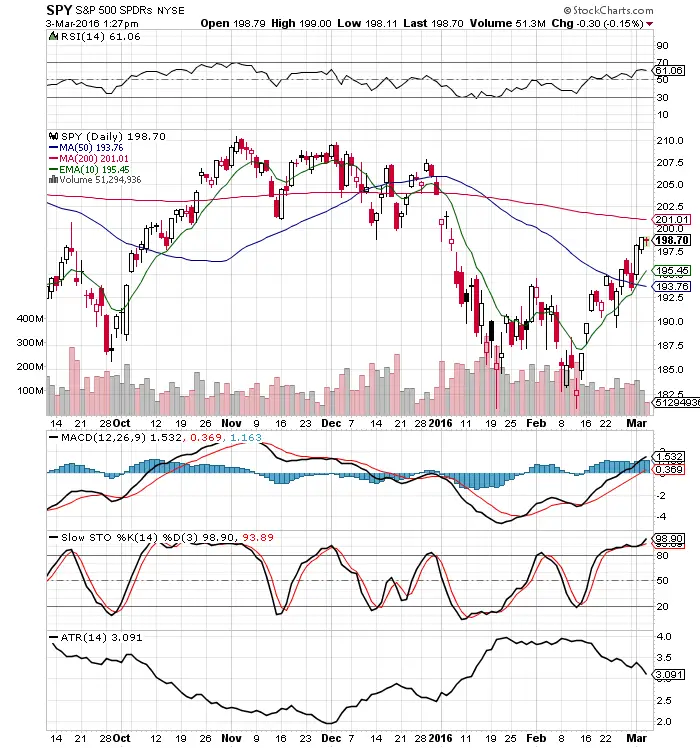 Chart Courtesy of StockCharts.com
Signals help traders filter out their opinions and focus on price action. These tools help capture trends in your own time frame.
- The 200 day SMA measures the long term trend. Price above long term bullish, prices below signal long term bearish.
- The 10 day EMA measures the short term trend. Price above short term bullish, prices below signal short term bearish.
- The MACD crossover can signal an intermediate swing trade.
- The Slow Stochastics crossovers can signal short term reversals in the trend.
- A declining ATR shows volatility decreasing and an ascending ATR shows volatility increasing. This is a signal to help calibrate position sizing.
- The RSI shows the risk/reward ratio increasing and decreasing. The 30 RSI favours the bulls risk/reward for entry and the 70 RSI favours the short sellers risk / reward ratio.
The magic of these trading indicators comes when you combine them to create your own trading methodology that fits your own risk tolerance levels and then trade your system with the right risk management and discipline.
The original article is posted by Steve Burns on newtraderu.com and is available here.
 Investing isn’t, and can’t be, about soothsaying market levels or about technical `timing’ of the markets. It also is not about finding that next new `wave’, `mega theme’ or `grand’ strategy; nor is it about dwelling on national or global economic macros.Investing remains a simple, rather dull and boring, uncluttered practice of bottom-up stock picking, with painstaking efforts and arduous discipline.
The rest are popular sports, meant for amusement, occasional applause but not for adoption. If the investing skills were to degenerate to mere predicting of market levels and, hoisting the investing boat just at the right point of time such that rising tide lifts the boat, it would have been an embarrassing branch of knowledge. But fortunately , it is not.
Capital preservation and capital appreciation remain the pillars and cornerstone objectives of a good investing philosophy. While both are almost equally important, preservation precedes appreciation. That precedence has a telling effect on investing philosophy and strategy conceptualisation.
Continue Reading →
Indices remained buoyed on Friday, ahead of the government’s meeting with foreign portfolio investors (FPIs) and representatives from the financial sector, which was scheduled later in the day. Sentiment was further strengthened on reports that government could approach the Goods and Services Tax (GST) Council to relieve the auto-industry from tax payment for three-six months along with measures to relieve real estate sector.
The benchmark S&P BSE Sensex soared 480 points intra-day to 37,807.5 level, while the Nifty50 zoomed 149 points to 11,181 mark.
At close, the Sensex settled 255 points, or 0.68 per cent, higher at 37,582 levels lifted by gains in auto and banking counters. Maruti Suzuki, Vedanta, Bajaj Finance, and HDFC Bank were the top gainers while YES Bank, Tech Mahindra, Tata Steel, and ITC were the top laggards. The broader Nifty50, too, ended at 11,110 mark, up 77 points, or 0.7 per cent.
Sectorally, metal, information technology (IT), pharma and public sector bank (PSBs) indices ended in the red while auto, private bank, realty, and FMCG scrips ended with gains. Nifty auto index was the top gainers, up 2 per cent, while Nifty metal index slipped 0.68 per cent.
In the broader market, the S&P BSE mid-cap index ended 104 points, or 0.77 per cent, higher at 13,670 level. The S&P BSE small-cap index, on the other hand, settled 125 points, or 1 per cent, higher at 12,699 level.
Continue Reading →
It is easy to become obsessed with adding to our trading arsenal with knowledge, books, chart patterns, indicators, moving averages, and gurus, that we forget to analyse what we need to remove from our plan.
One of the largest determining factors as to whether a new trader ends up as a winning trader, is how well they can filter out what doesn’t help them make money. Traders can’t follow every indicator, trade every method, and endlessly add to their trading methodology. As traders we have to make choices. We must know what makes money and what to remove from our trading strategy.
- Give up your need to be right: The market is always right, don’t strive to be right in your predictions and opinions. Strive to go with the flow of the market.
- Give up control: No matter how long you watch a live stock stream, you have no power over the movements. Save your emotional energy by not trying to cheer on your positions and get wrapped up in every price tick.
Continue Reading →
In my experience, investors sitting on a lot of cash are usually worried about equity valuations or the economy, and tell themselves and others that they’re going to buy gobs of stock after a crash. The strategy sounds prudent and has common sense appeal—everyone knows that one should be fearful when others are greedy, greedy when others are fearful. But historically waiting for the market to fall has been an abysmal strategy, far worse than buying and holding in both absolute and risk-adjusted terms.
Using monthly U.S. stock market total returns from mid-1926 to 2016-end (from the ever-useful French Data Library), I simulated variations of the strategy, changing both the drawdown thresholds before buying and the holding periods after a buy. For example, a simple version of the strategy is to wait for a 10% peak-to-trough loss before buying, then holding for at least 12 months or until the drawdown threshold is exceeded before returning to cash. This strategy would have put you in cash about 47% of the time, so if our switches were random, we’d expect to earn about half the market return with half the volatility.
The chart below shows the cumulative excess return (that is, return above cash) of this variation of the strategy versus the market. Buy-the-dip returned 2.2% annualized with a 15.7% annualized standard deviation, while buy-and-hold returned 6.3% with an 18.6% standard deviation. Their respective Sharpe ratios, a measure of risk-adjusted return, are 0.14 and 0.34, meaning for each percentage point of volatility buy-the-dip yielded 0.14% in additional annualized return and buy-and-hold yielded 0.34%.
Continue Reading →
Fresh trade war concerns between the United States and China weighed down investors’ sentiment on Friday leading to a sluggish trade through the day. The benchmark S&P BSE Sensex and the broader Nifty50 plummeted 411 points and 131 points respectively during the intra-day trade before staging a smart recovery during the last trading hour.
Indices inched higher on reports that the PMO took stock of the steep sell-off being witnessed in the market since the presentation of the Union Budget 2019-20. Reports suggested that PMO met officials from the Finance Ministry on Thursday to discuss concerns raised by the FPIs and even considered proposals submitted by them.
The Sensex closed at 37,118 level, up 100 points, or 0.27 per cent with Bharti Airtel, Asian Paints, Bajaj Auto, and Maruti being the top gainers. On the other hand, Tata Steel, SBI, Vedanta, and ONGC ended the day with steep losses. The broader Nifty50 failed to hold the psychological 11,000-mark to end at 10,997, up 17 points, or 0.16 per cent.
In the broader markets, S&P BSE Mid-cap closed at 13,547 level, up 20 points, or 0.15 per cent while the S&P BSE Small-cap settled 55 points, or 0.44 per cent, lower at 12,496 level.
Sectorally, metals slipped the most as risks to global economy increased after US President Donald Trump imposed fresh tariffs Chinese imports. The index dipped 2.16 per cent at close, followed by Nifty PSU Bank, down 1.12 per cent. Among the gainers, Nifty Auto index ended 1.26 per cent higher, followed by Nifty IT index, which gained 0.57 per cent on the back of weaker rupee.
Continue Reading →
“Whenever I enter a position I have a predetermined stop. That’s the only way I can sleep at night. I know where I’m getting out before I get in.”- Bruce Kovner
The biggest reasons traders end up unprofitable is simply because their big losses knock out all their previous gains.
If you went back and removed your biggest losses over the past few months or year what would your trading results look like? Many of the best traders I know did this at some point in their trading careers and had an enlightening moment. The major factors that made them unprofitable or caused them big draw downs in capital were the big losses. The roots of the big losses were usually based in emotions and ego not a market event. A big loss is almost always caused by being on the wrong of a trend and then staying there.
What are the top 10 root causes of big losses in trading?
- Too stubborn to exit when proven wrong: You just refuse to take a loss; you think a loss is not real as long as you do not exit the trade and lock in the paper losses.
- Too much ego to take a loss: You are on the wrong side of the market trend but think if you hold a losing position you can be proven right on a reversal. While you are waiting to be proven right your loss gets bigger and bigger.
Continue Reading →
One of the investors we follow closely here at The Acquirer’s Multiple is Steven Cohen, founder and chairman at Point 72 Asset Management. According to their last reported 13F filing for Q2 2018, Point72 has $25.056 Billion in managed 13F securities.
Cohen recently wrote a great article together with Matthew Granade, managing partner of Point72 Ventures, at the WSJ which provides a warning for investors based on the impact that model-driven companies are having on the changing business landscape saying:
“Software continues to eat the world, but yesterday’s advantage is today’s table stakes. In the hunt for competitive advantage, model-driven companies will accelerate away from the pack now that software has become ubiquitous.”
Here’s an excerpt from that article:
The software revolution has transformed business. What’s next? Processes that constantly improve themselves without need of human intervention.
Marc Andreessen’s essay “Why Software is Eating the World” appeared in this newspaper Aug. 20, 2011. Mr. Andreessen’s analysis was prescient. The companies he identified— Netflix , Amazon, Spotify—did eat their industries. Newer software companies—Didi, Airbnb, Stripe—are also at the table, digging in.
Continue Reading →


