With the new website in place, we felt our users would want to ask something so here is a list of some FAQs.
Question: How do I benefit from signing up for StockArchitect?
Answer: Once you have signed up, you will be able to track views on a particular stock or views of a particular user. You will also get to view the consolidated results at a user or stock level.
Question: What are the requirements to login to the system?
Answer: All you require is a Twitter or Facebook or LinkedIn username and password. If you don’t have either of these, just create one by going to the signup page.
Question: Will my password be stored on your server? What about privacy?
Answer: We at StockArchitect do not store any passwords on our servers. We use APIs such as Twitter’s oauth which are highly secure authentication systems.
Question: Why are my views not visible on StockArchitect?
Answer: At StockArchitect, our systems go through millions of views on social media using Artificial Intelligence and Natural Language Processing. Views are curated and based on that the scores are given for selection. In order for your views to show up, please go through these best practices:
- Include the relevant name of the stock or the symbol in your message. This will ensure that the system classifies your message properly into that company.
- If you are sharing a news item or any other published content, be sure to mention the name of the stock or the symbol. Please paste the original URL. We will shorten it and publish it as a clickable URL. Please credit the source where possible.
- You will surely come across someone sharing content you like. In such cases do give them a pat on their backs by liking the post. Praise is contagious.
- Be helpful to others who ask questions.
- Everyone hates spam so do we. So please don’t send links to advertisements or advertise your services.
- Trolls – Everyone encounters them right from the celebrities to the common investor. They believe abusing is their birthright so if you encounter someone like that just ignore. Please don’t get into a slugfest. Remember it is a sheer waste of time and effort.
If after all of these, you feel that your views match the above criteria and still don’t show up please write to us on support@stockarchitect.com
Question: Why are my views visible on StockArchitect?
Answer: At StockArchitect, our systems receive millions of views using public APIs. The views then go through the process of curation using Artificial Intelligence and Natural Language Processing. Based on that the scores assigned and the relevance of the content, views are selected. Since your view was relevant and passed through the criteria defined, it was selected to show up.
Question: I have successfully logged in. What next?
 Answer: Welcome to StockArchitect. When you login for the first time, you will be asked to fill in certain fields to complete your profile and will also see some suggestions on who you could follow. After that, you will see a rolling ticker on top. This shows the trending stocks and when you click on the name of any stock, you will be taken to the page for that particular stock. We suggest that you add some stocks in your watchlist that you are following or wish to follow. You may also track users who post views on these stocks to gain advantage of his views on other stocks as well.
Question: How do I find a stock I wish to follow?
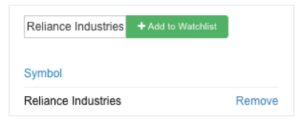
Answer: On the top left corner, you will find a search box in which you can enter the name of the scrip you wish to follow.
Question: The stock I wish to follow doesn’t appear on the list. What do I do?
Answer: We are sorry but if you could send a mail to feedback@stockarchitect.com, we will put them up for inclusion in the future releases.
Question: Which are the trending stocks?
Answer: Trending stocks are the Top 10 discussed stocks during the past 24 hours by investors and traders on social networks.
Question: Who are active users?
Answer: Active users are those who have posted the most number of views about stocks recently.
Question: What does the Following box signify?
Answer: The following box shows those investors / traders you are following.
Question: What does the “All” tab mean?
Answer: The All tab shows you all the curated views. These are not filtered for a particular stock or user.
Question: What does the tab titled “Charts / Media” show?
Answer: It shows those views which have some kind of charts or images. Again these are not filtered for a particular stock or user.
Question: What does the tab with the label “Followers Picks” show?
Answer: This tab shows the views of those users that you have decided to follow.
Question: What does the tab with the label “My Stocks” show?
Answer: This tab shows the views on the stocks you have decided to follow.
Question: What does the tab titled “Likes” show?
Answer: This tab shows those views that you have liked.
Question: What does “Who to follow” mean?
Answer: This indicates some of the recommended users who you many choose to follow.
Stock Specific View
When you want to have a look at a particular stock you get to see the stock specific view.
Question: What does active user signify?

Answer: Active users are the top 10 people who share their views about that particular stock the most. It also states the number of posts / calls posted by them over a period of time on that particular stock.
Question: What does the “All” tab mean?
Answer: The All tab shows you all the curated views for that particular stock.
Question: What does the tab titled “Charts / Media” show?
Answer: It shows those views which have some kind of charts or images for the selected stock.
Question: What does the “Today” tab mean?
Answer: The Today tab shows you all the views for that particular stock posted on that day.
Question: What does the graph mean?
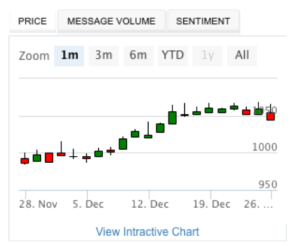
Answer: The graph shows the price movement of the stock in question. You can view the graph over a period of 1 month or 3 months or 6 months or Year to Date and all time. There is also an Interactive chart which shows you the graph along with the other tools for you to analyse the stock price movement.
The message volume option is the graphical view of the number of messages over the past week for the particular stock.
Sentiment is a graph which suggests the overall mood in the market based on the views for that day. You can hover the mouse to see the mood over different days.
Question: What does Overall Stock Sentiment signify?
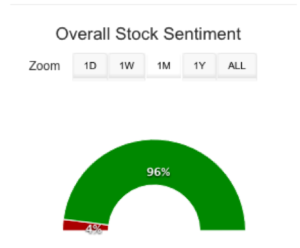
Answer: The Overall Stock Sentiment is a graphical representation that suggests the views of users (bullish, bearish or neutral) analysed over the period selected ie 1 day or 1 week or 1 month or 1 year or over the entire period.
User Specific View Page
As you get to a particular user’s page, you will get to see all views posted by that user.

You can see the number of views under Feeds, the number of people the user is following, the number of followers and the number of views that have been liked.
Question: What is the significance of the column “Top Posts”?
Answer: “Top posts” shows the list of stocks about which the user mostly writes on. It also shows the number of views on that particular stock.
Question: What does the “All” tab mean?

Answer: The All tab shows you all the curated views of that particular user.
Question: What does the tab titled “Charts / Media” show?
Answer: It shows those views of that user which have some kind of charts or images.
Question: What does the “Today” tab mean?
Answer: The Today tab shows you all the views for that particular user posted on that day.
Question: What is “Overall User Sentiment” on a user’s page?
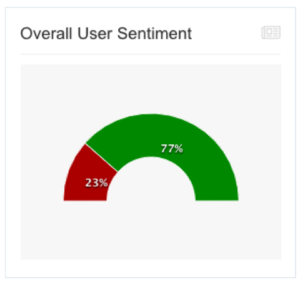
Answer: Overall sentiment is a graph suggesting the type of calls (bullish / bearish / neutral) posted by that user.
Follow us on Twitter, Facebook, Instagram, Pinterest, Google+
stockarchitect
January 1, 2017


 Answer: Welcome to StockArchitect. When you login for the first time, you will be asked to fill in certain fields to complete your profile and will also see some suggestions on who you could follow. After that, you will see a rolling ticker on top. This shows the trending stocks and when you click on the name of any stock, you will be taken to the page for that particular stock. We suggest that you add some stocks in your watchlist that you are following or wish to follow. You may also track users who post views on these stocks to gain advantage of his views on other stocks as well.


