Volume is representative of how many shares change hands in a stock, and as such, it indicates the interest in a security. Since each stock is different, and has a different amount of shares outstanding, volume can be compared to historical volume within a stock to spot changes, or compared to other stocks to find which are suitable for trading. Volume is also used to confirm price trends, breakouts, and spot potential reversals. Volume has also been implemented into indicators, which can aid in analyzing stocks (and other markets).
Volume Significance
Volume is important because it shows the level of interest in a stock. Current volume in a stock, relative to prior volume, shows if interest is higher or lower in a stock than it was before. High volume, or relatively high volume (compared to prior volume), is more suitable for active traders. Very low volume typically indicates a lack of interest and usually little price movement. Volume is also significant for screening stocks. Average volume—the typical volume seen in a day over a period time—helps greatly in this regard. Day traders need to be able to get in and out of a stock quickly and with ease, so they will want to trade stocks with high daily volume – typically 1 million shares at absolute minimum.Swing traders and investors have a little more leeway and therefore may trade stocks with lower volume, around 500,000 and 100,000 shares or more per day, respectively. They still want stocks that have enough volume to get in and out when they need to, but the urgency is not quite as high as it is for short-term traders.That’s the significance of volume as a defined number; here’s how to analyze it.
Analyzing Volume
There are three primary ways we can use volume in conjunction with price analysis: confirming trends (or not), spotting potential price reversals, and confirming price breakouts (or not).
Continue Reading →
The equity markets settled 1 per cent higher on Friday as the rupee recovered against the dollar.
The S&P BSE Sensex reclaimed the 38,000 mark to end at 38,091, up 373 points while the broader Nifty50 index settled at 11,515, up 145 points.
In the broader markets, the S&P BSE MidCap settled 1.6 per cent higher and the S&P BSE SmallCap rose 1.4 per cent.
Among sectoral indices, the Nifty Pharma index settled 2.5 per cent higher led by a rise in the share prices of Divi’s Laboratories and Piramal Enterprises. On the other hand, the Nifty Bank index rose 1.3 per cent led by YES Bank and IDFC Bank.
The rupee strengthened by over 60 paise to 71.58 against the US dollar in intra-day trade. On Wednesday, the domestic currency rebounded from its historic low of 72.91 to end higher by 51 paise at 72.18 against the dollar.
This apart, Prime Minister Narendra Modi will hold a meeting with finance ministry officials later in the day to discuss the fall in the rupee and other economic issues. Rupee is Asia’s weakest currency in 2018, down more than 12 percent on a widening current account deficit and higher oil prices.
Continue Reading →

The benchmark indices ended higher on Friday aided by strong gains in automobiles and metal stocks after the rupee firmed against US dollar. The S&P BSE Sensex ended at 38,390, up 147 points while the broader Nifty50 index settled at 11,589, up 52 points.
Among the sectoral indices, the Nifty Auto index settled 2.2 per cent higher led by a rise in the share prices of Hero MotoCorp, Bajaj Auto, Mahindra and Mahindra, and Tata Motors. Nifty Metal index, too, rose 1.9 per cent led by MOIL and Jindal Steel & Power.
The rupee was trading higher by 24 paise to 71.75 against the US currency in late morning deals on Friday due to sustained bouts of dollar selling from banks and exporters. Earlier, the rupee resumed slightly higher at 71.95 against yesterday’s closing level of 71.99 a dollar at the interbank foreign exchange market here.
Shares of YES Bank hit an over four-month low of Rs 322 per share, down 5% on the BSE on the back of heavy volumes. The stock was the largest loser among the S&P BSE Sensex and Nifty 50 index.
Continue Reading →
The benchmark indices ended flat on Friday amid weakness in the rupee, which hit a new low breaching 71 per dollar mark for the first time earlier today.
The S&P BSE Sensex ended at 38,645, down 45 points while the broader Nifty50 index settled at 11,680, up 4 points.
Among sectoral indices, the Nifty Pharma index rose 2.7 per cent led by a rise in Lupin and Dr. Reddy’s Laboratories. The Nifty IT index, too, settled 1.8 per cent higher led by Tech Mahindra and MindTree. However, Nifty Bank index slipped 0.15 per cent due to a fall in YES Bank’s shares.
The rupee slumped to a fresh record low of 71 against the dollar for the first time ever by falling 26 paise on persistent demand for the US currency amid rising crude prices. At the Interbank Foreign Exchange (Forex) market, the local currency opened lower at 70.95 a dollar and slipped further to hit its lifetime low of 71 from its previous close of 70.74.
J B Chemicals & Pharmaceuticals rose 1.51% to Rs 342.20 on BSE after the company’s board of directors the buy-back of equity shares. The announcement was made during market hours today, 31 August 2018.
Continue Reading →

The U.S. stock market plunged Monday, with the Dow Jones falling nearly 1,600 points at one point, the biggest single-day drop in its history. It then turned around and regained 567 points on Tuesday. What the remainder of the week holds in store is anyone’s guess.
Many experts had been forecasting a decline for months after a prolonged upswing resulted in a series of record highs. Several factors are likely to have been involved. The Bureau of Labor Statistics January jobs report, released on Friday, was almost certainly one of them. It generated worries about inflation and bond yields, together with concern The Federal Reserve may raise interest rates faster than expected—events that may have “spooked” the markets.
Markets translate the decisions of millions of people into a price for a stock or bond. Like a spooked crowd in a public place, investors tend at times to run in the same direction—let’s all play the lottery or let’s escape the burning movie theater.
The work of visionaries such as Nobel laureates Richard Thaler and Daniel Kahneman has demonstrated humans do not operate as rational agents, as assumed by classical economics. From this realization have emerged disciplines such as behavioral economics, neuroeconomics and the like.
Continue Reading →
The benchmark indices settled marginally lower on Friday weighed by financials and consumer stocks amid caution in global markets.
The S&P BSE Sensex ended at 38,252, down 85 points while the broader Nifty50 index settled at 11,557, down 26 points.
Among key stocks, Yes Bank and ICICI Bank were among the top losers on the BSE, falling 3.5 per cent and 2 per cent, respectively.
On the National Stock Exchange (NSE), the Nifty Bank index settled 0.7 per cent lower weighed by Yes Bank, Bank of Baroda and ICICI Bank.
Shares of selected pharmaceutical companies were in focus with Amrutanjan Health Care, Pfizer, Merck and Novartis India rallying up to 18% on the BSE in otherwise subdued market. All these stocks were trading at their respective all-time highs.
Analysts remain bullish on Larsen & Toubro (L&T) and have maintained a ‘buy’ rating on the stock despite the company’s buyback proposal. The company, at its meeting on Thursday, approved a proposal to buy back up to 60 million equity shares at a maximum price of Rs 1,500 per equity share for an amount of Rs 90 billion.
Continue Reading →
Bull markets seem like they should be easier than the alternative but even dealing with gains can be challenging as an investor. Research shows that investors trade more often during bull markets because we don’t know what to do with gains, it’s difficult to hold winners, and there are constant temptations with even bigger winners elsewhere. This piece I wrote for Bloomberg looks at how to deal with big gainers in your portfolio.
*******Major stock indexes are hitting new highs almost daily, adding to the huge gains many securities have posted in recent years. For example, Nvidia Corp. has gained almost 1,800 percent since the start of 2013. Over the past five years or so, Netflix is up 1,375 percent; Tesla is up 835 percent; Facebook is up 590 percent, and Amazon has risen 380 percent. Bitcoin is up more than 900 percent in 2017 alone.If you’ve been fortunate enough to be involved in any of these equities or other market stars, you made the right choice. But investors would be wise to work through their options on how to handle these stocks. Large gains in your portfolio are a good problem to have, but the good news also comes with psychological baggage. Continue Reading →
The benchmark indices settled higher on Friday taking cues from their Asian peers.
The S&P BSE Sensex ended at 37,948, up 284 points while the broader Nifty50 index settled at 11,471, up 86 points.
Among key stocks, the fast moving consumer goods (FMCG) major ITC rose over 2 per cent to end at Rs 313 levels on the BSE. The stock hit a fresh 52-week high of Rs 315 earlier today. ICICI Bank and State Bank of India also ended higher in a range of 1.8 to 3.0 per cent on the BSE.
Among sectors, the Nifty Pharma index ended higher for the fourth straight day, hitting an over six-month high on the National Stock Exchange (NSE). Sun Pharmaceutical Industries, Dr Reddy’s Laboratories, Glenmark Pharmaceuticals, Lupin, Aurobindo Pharma and Cadila Healthcare from the index, were up in the range of 1 per cent to 4 per cent on the NSE.
Shares of paper companies were trading higher on the bourses on expectations of a positive outlook for the current July-September quarter.
Continue Reading →
Introducing the Convergence Tool from StockArchitect
What is convergence?
In simple terms when different moving averages are in a range of 1%, convergence is said to have occurred. In the Convergence Tool, we are using 4, 9, 18, 50 and 200 DMA (daily moving average) to determine convergence.
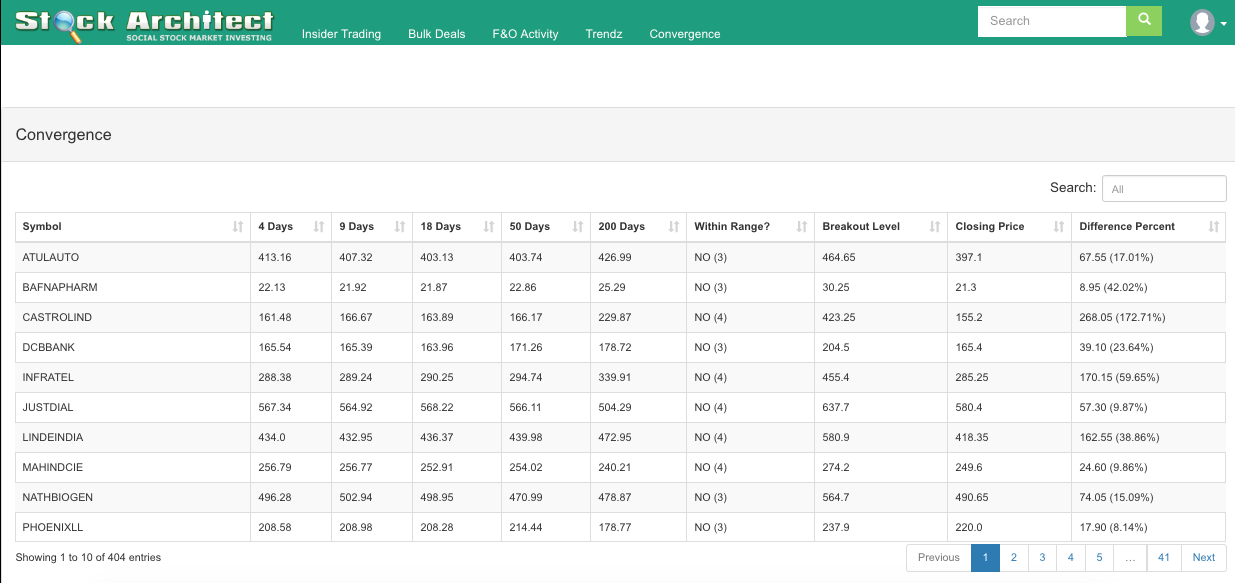
After you have subscribed to the convergence tool (or during the 7 day free trial period as the case maybe), you will see this screen below:
As you can see we work on 4, 9, 18, 50 and 200 MA.
The “Within Range” column displays 2 values
- Yes which means a convergence of 5
- No (4) or No (3) which means convergence of 4 or 3 respectively.
How do I make use of the data displayed by the Convergence Tool?
Continue Reading →


