Daniel Kahneman once said, “Hindsight makes surprises vanish.” The hindsight bias can lead investors to constantly fight the last war. Since the financial crisis the last war has made top calling in the markets a cottage industry. Looking back now the peak before the prior crash looks easy. It was not. Predicting when the music will stop is not easy. This piece I wrote for Bloomberg shows why.
*******
There’s a simple reason the future always feels uncertain but the past seems relatively orderly: No one has any idea what the future holds, while hindsight allows us to assume that the past was more predictable that it actually was.
Take the Great Financial Crisis. The majority of investors, economists, policy makers and regulators were completely blindsided by the worst economic and stock-market downturn since the Great Depression. Yet when these same people look back at that fateful 2007-2009 period, it seems many of them now believe that they knew it was coming and called it in advance.
It can be very lucrative to be right about major market events. Many who actually did see the crisis coming became household names in the finance industry and parlayed that success into book deals, keynote speeches, television appearances and “thought leader” status. Since so many people were cheerleading right up until the market crash, no one wants to get caught flat-footed again, leading to a steady increase in the number of people now calling for a market top.
Continue Reading →

What is price action trading and why it does make you a better trader
Price action trading is a type of trading that allows traders to observe and study the current market. This, in turn, allows you to anticipate the market trend and make certain assumptions/decisions based on the current (and actual) price movements.
Price action trading is the purest type of trading that eliminates all noise.
It does not anticipate, it reads the market.
Price action is great!
Is price action trading better than other types of trading?
Hard to say.
It is really difficult to say if one type of trading is better than another. What matters is which type of trading fits your personality.
Another important element of trading is money management. What matters is even not that much the trading system, but the way you use it.
Profitable traders will agree with me.
Continue Reading →
Trading with the trend is trading with the flow. When the prevailing trend is up, why would you want to look for short entries when buying might result in much smoother trades? Many amateur traders, even when facing a long lasting trend that has been going on for months, can’t stop trying to predict reversals, whereas they could have made so much more money by simply joining the trend.
But even if you are not a trend-following trader, you can combine the concept of trading with the higher timeframe trend with your regular trading approach: you start on the Daily timeframe and see if the trend its up, down or sideways and you use that information on your lower, execution timeframe to time your trades (read here: how to perform a multi-timeframe analysis). To be able to correctly read price action, trends and trend direction, we will now introduce the most effective ways to analyze a chart.
Intro: The different market phases
Before we start going over how to identify the trend, we should be first clear what we are looking for. Markets can do one of three things: go up, go down, or move sideways.

The picture above shows you the three possible scenarios and how markets keep alternating between the phases. But knowing what has happened after the fact is always the easy part. The hard part is finding out what is currently happening when markets are moving in real time and the space on the right is empty – that’s where this article comes in. To be clear, the article is not meant to show you how to identify trading entries, but to understand price and trends in a more efficient way.
Continue Reading →
If you are confused about how to trade / invest when you have an opinion or follow one then you do need to get yourself a lesson in trend following. Elliott Wave analysis is meant for market forecasting but actual trades have to be taken based on classic technical tools that give you levels to manage a trade. It is my belief in this process that I do not give calls or tips. I do the difficult part of taking a view and take the flak for it when wrong.
However to successfully make money you will need to add Position sizing to either your investment decisions or trading decisions so that you can minimise losses and maximise gains. So I would expect you to learn some of that. In today’s note, I will give you a head start on this.
If you do not know how to trade at all then you first need a lesson in trend trading however if you want to know which trend to trade you have come to the right place. Learning to trade involves knowing.
1. How to buy/Sell
2. Time to monitor trades, to get out of losing trades
3. Understand support resistance
Continue Reading →
Quantified trading signals can be based on different types of strategies. Some buy high in the hopes of selling higher, while others try to create a great risk/reward ratio by buying low hoping to sell on rebounds or reversals in price action. Here are four different types of trading signals.
- Momentum signals are based on buying strength. Momentum traders wait for a strong move in a stock and then buy and get on-board for a short amount of time. Momentum traders usually trade short time frames of days. These work primarily in bull markets.
- Breakout signals are based on buying all-time highs or 52 week highs, trying to buy high and sell higher. Breakouts are bought trying to catch a parabolic move where a stock could double or even triple over weeks and months. These work primarily in strong bull markets when indexes break to all-time highs.
- Buying oversold dips are based on buying a long term price support level or an oversold oscillator like the 30 RSI, a price extension far from the 10 day EMA, or a -80 to -100 $NYMO. This signal tries to create a great risk/reward ratio based on buying a deep dip of a historical price range. These work best in range-bound markets.
- Trend following signals try to go in the direction of the long term trend by using long term moving averages like the 200 day SMA breaks as buy or sell signals, or all-time highs or lows to enter longs or shorts. These work in trends with higher highs or lower lows.
The original article is authored by Steve and appears on New Trader U. It is available here.
The original article is written by Steve of Trading Method, Trading Plan and can be found here.
Most new traders think their win rate is the most important math in their trading. It is not, your risk / reward ratio will determine your profitability more than a win rate.
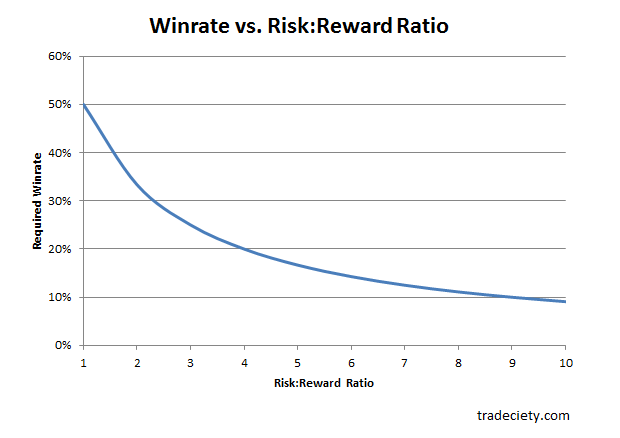
Chart Courtesy of Tradeciety.com
Continue Reading →


