How to use the Convergence Tool?


Introducing the Convergence Tool from StockArchitect
What is convergence?
In simple terms when different moving averages are in a range of 1%, convergence is said to have occurred. In the Convergence Tool, we are using 4, 9, 18, 50 and 200 DMA (daily moving average) to determine convergence.
After you have subscribed to the convergence tool (or during the 7 day free trial period as the case maybe), you will see this screen below:
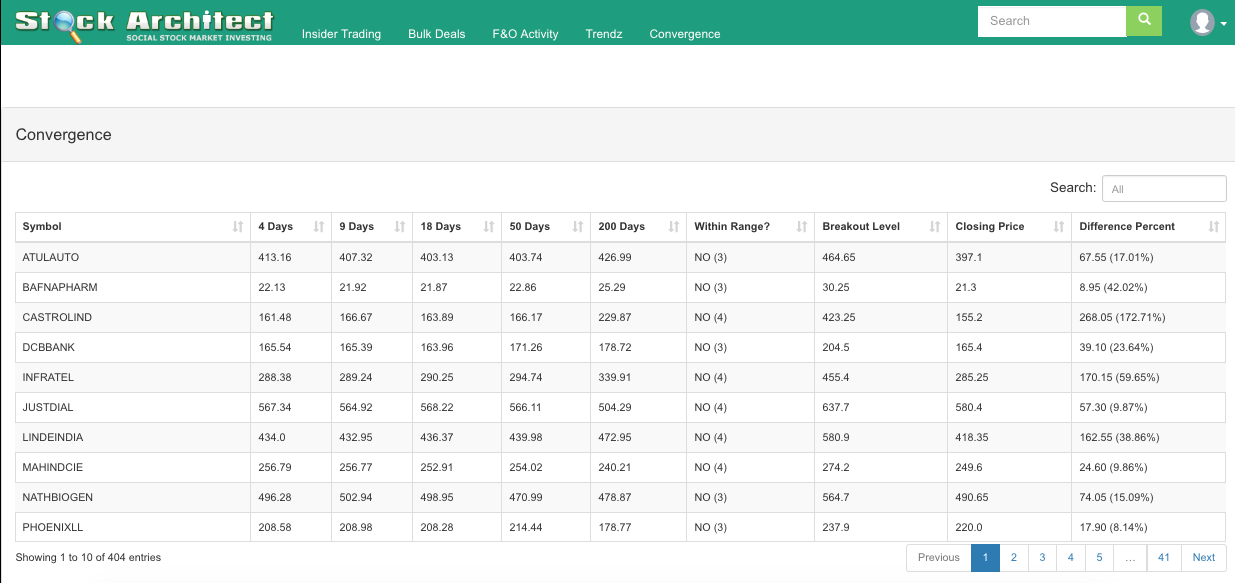
As you can see we work on 4, 9, 18, 50 and 200 MA.
The “Within Range” column displays 2 values
- Yes which means a convergence of 5
- No (4) or No (3) which means convergence of 4 or 3 respectively.
How do I make use of the data displayed by the Convergence Tool?