A new feature on StockArchitect – F&O Activity


The Indian equity market has a long history and there are many participants in it. These participants include retail traders / investors, institutions (Domestic as well as Overseas), prop desks, arbitrageurs, hedgers, etc. Retail participants invest in the market both directly and indirectly through institutions. These institutions are known as Domestic Institutional Investors (DIIs) and comprise of Mutual Funds, Banks, Insurance companies etc.
On the other hand, Foreign Institutional Investors (FIIs) or Foreign Portfolio Investors (FPIs) are overseas entities registered in India and allowed to invest in the Indian stock markets. They play an important role in our market as they hold a decent chunk of overall investment in Indian equities.
FII activity in cash market segment should not be traced as a trading signal because they invest with long term perspective mainly. This data should be used as a helping tool for forming a positional view on the market. For short term trading their future & options activity should be tracked.
The foreign institutional investors (FIIs) activity in the futures & options (F&O) segment is crucial for Indian markets in terms of setting the short-term trend.
Since it has proved decisive during the last few years to predict the undercurrent of the market, Indian traders and investors keenly analyze FII data published by NSE India after the end of trading hours.
FIIs can buy or sell an index or stock future according to their views on the market / stock. Also, they can go long or write the index or stock options as per their strategy requirement. NSE provides all the data on their website (historic data too available on the website).
For the convenience of our subscribers, we have crunched all the data on our website. Link of the same posted below:
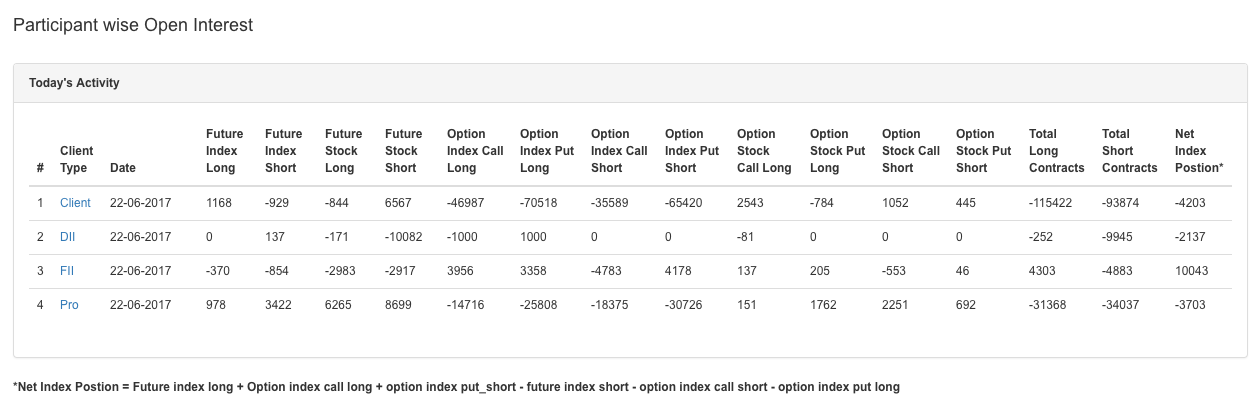
Here, you can see the participant wise activity in F&O segment. By clicking on the Client Type, a new page of their activity on different dates will open. All the data mentioned here is in the number of contracts.
The data is segregated as per NSE’s website like ‘Future Index Long’, ‘Future Index Short’, etc., which can be easily understandable as per their heading. However, few get confused in options like ‘Option Index Put Short’. A positive figure under that heading indicates that the participant has shorted the put option, while a negative figure indicates participant has exited the short positions in put option.
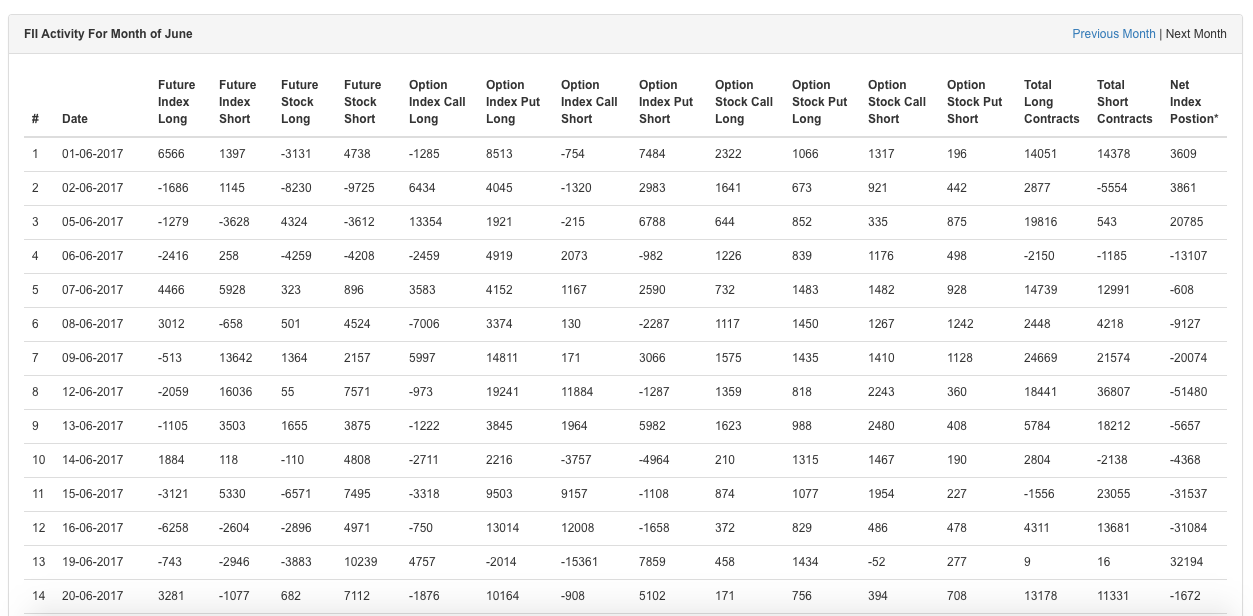
Since the number of stocks in future and options segment is more than 200, it is difficult to analyze FIIs’ F&O activity in stocks. While in index segment, FIIs mainly trade in Nifty and BankNifty.
In last column, we calculated net positions in index on particular day. Formula of the same is mentioned below :
Net Index Postion = Future index long + Option index call long + option index put_short – future index short – option index call short – option index put long
This data may be used to make any system on doing some back-testing. However, this data is not suggestive of any trades; and should only be used as a supporting tool with your existing trading methods. The data is by no means, a recommendation to buy or sell and should not be treated that way. Users are advised to take informed decisions and consult their financial advisers before taking any investment decision. StockArchitect is not responsible for any gains or losses made by the users of the website in any manner. For detailed disclaimer, please refer to http://stockarchitect.com/disclaimer
Mehul Kothari
June 27, 2017 - 10:25 am
Whats your email id..Need to send you one input
stockarchitect
July 1, 2017 - 6:17 am
Thanks for your message Mehul. You can mail on dhaval@stockarchitect.com